Maria Brock’s journey from Tableau Student Ambassador to full-time data analyst


This year, Tableau Public is celebrating its 10th anniversary. Since the platform was founded in 2010, millions of people have used Tableau Public to develop their data visualization skills, find inspiration, and connect with like-minded data enthusiasts from around the world. While we’re thrilled to be celebrating this milestone, we also want to acknowledge the accomplishments of those in the Tableau Community, like Maria Brock, who is well into her first year at Booz Allen Hamilton, designing and developing Tableau dashboards for the firm.
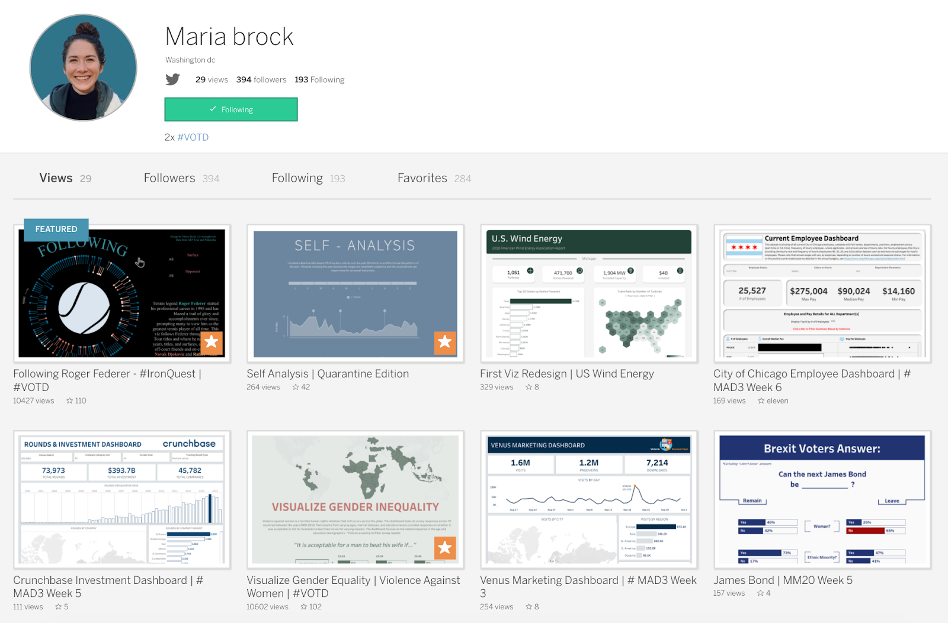
Maria Brock is a first-year data analyst at Booz Allen Hamilton and a former 2019-20 Student Ambassador. She’s the author of The Tableau Student Guide, a “one-stop-shop” website for beginners in Tableau. She loves data analytics and specializes in design and visualization best practices with business dashboards. Read on to learn what Maria’s been able to accomplish in only a year and a half of using Tableau.
How long have you been using Tableau?
I’ve been using Tableau for about a year and a half. I was introduced by a family friend who works for Tableau, but I never fully plunged in until my first internship last summer. During that internship, I exclusively used Tableau and was introduced to Tableau Public and the wider community. I consider myself lucky that I discovered the community and all Tableau’s riches so early in my career.
What role has Tableau Public played in your professional development?
Tableau Public, and Tableau itself, really kicked my development into full gear. I started working with Tableau during my data analytics internship. Using Tableau Public motivated me to start creating vizzes for fun, and the more I created, the more I learned. It’s been invaluable for motivation, inspiration, and personal development. It’s also nice to go to a place where you can learn more about a subject without having to read pages and pages—you can fit a lot of information into one dashboard! When I interned over the winter for Lovelytics, Tableau Public was a great place to go for business dashboard inspiration. A lot of my work there focused on formatting and design, so seeing a lot of the great designs that people were pushing helped spark my own creativity.
Last year you were a Tableau Student Ambassador. Can you tell us more about that experience?
Being a Student Ambassador was a wonderful experience. In 2019, Tableau kicked off its Student Ambassador program for the first time. Throughout the year, there was a lot of collaboration between the team at Tableau and the students around the globe as we both figured out how to best implement this program. During the year, (I don’t remember the exact number), I ran about 12-15 sessions teaching Tableau to students on my campus. Some of these sessions would be attended by 30+ students, others were private sessions for clubs and fraternities, and others were tutoring sessions. I created lesson plans, compiled resources, and provided networking opportunities for the students. It was quite the job! I enjoyed helping the students because I had been helped when I was starting out my career, so I wanted to give back.
During your time as an ambassador, you created The Tableau Student Guide. Can you tell us a little more about it?
The Tableau Student Guide (TSG) is a comprehensive website that features around 32 articles consisting of tips for getting started with Tableau, resources, and interviews. I created the TSG because I was teaching Tableau to college students as a part of my ambassadorship. It was difficult to keep track of all of the different resources, so I decided to create something that would be a “one-stop-shop” for beginners. I decided to share it with the broader community, and it became a hit. I don’t and never intended to keep it “updated,” but what I put together is pretty timeless because it covers the basics. I get messages every so often from #DataFam newcomers who were able to get started with Tableau because of my guide and I always appreciate hearing that it’s been able to help people!
Do you have a favorite viz or author on Tableau Public?
Golly, how to pick? I really love the vizzes by several authors who tend towards clean-cut designs like Daria Voronov, David Borczuk, and Judit Bekker. They all have fantastic ways of showing their creativity through very clean and straightforward designs. Daria excels in creating clean-cut, minimalistic designs for business dashboards. David uses neomorphism and sharp layouts to tell his story, and Judit makes terrific use of white space and expansive design. They’re my inspirations!
We are celebrating 10 Years of Tableau Public. What is your favorite feature of Tableau Public?
Honestly, just the fact that we have Tableau Public at all! It’s a great, easy to use platform where you can put your portfolio in one place. I especially love the ability to favorite different vizzes so you can come back to them again and again.
If members of the #DataFam visit Washington, DC what do you recommend they do?
Depends on what they like to do! Of course, visiting the museums and monuments are super fun, but I recommend checking out Georgetown and Old Town Alexandria as well—they’re very charming areas with beautiful restaurants, parks, and historic areas. If you’re more of a nature person like me, Great Falls Park is a great hiking spot with views of big waterfalls. My top recommendation would be to visit Skyline Drive in Shenandoah National Park. It’s about an hour outside of DC and you can see wonderful views of the Shenandoah Valley throughout the drive. Northern Virginia, especially Loudoun County, is known for its wineries, so visiting towns like Leesburg can be a great experience if you’re into visiting wineries or breweries (most of which come with amazing views).

Congratulations, Maria—we can’t wait to see what’s in store for you next. Want to stay up-to-date with Maria’s latest work? Be sure to follow her on Tableau Public.
เรื่องราวที่เกี่ยวข้อง

Iron Viz 2026: Read Between the Data
 May 28, 2026

Tableau's Iron Viz Winners

Explore the 2026 Iron Viz Entries
 ธันวาคม 15, 2025