Intro to Level of Detail Expressions


If you’ve looked at any Tableau 9.0 material, you’ve likely seen the phrase “LOD Expressions”. Don’t be afraid! Level of Detail (LOD) Expressions can be extremely fun, and powerful, to work with. This post is meant to get you excited about LOD Expressions, not to be an exhaustive how-to-use-LOD-Expressions-for-every-single-scenario-possible. However, I will provide an overview of WHAT an LOD Expression is, WHY you should use one, and HOW one can expand the questions you can ask of your data.
What is the "Level of Detail"?
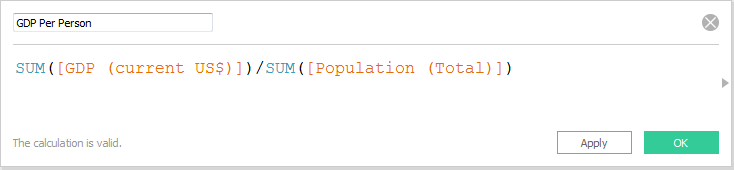
Suppose we have data from the World Bank that contains each Country’s GDP and Population and you’d like to compute the GDP/Person. This results in a fairly simple calculated field:
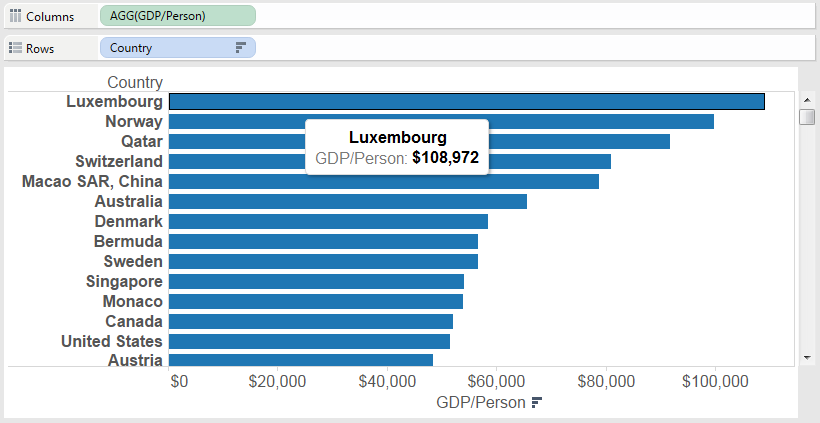
Because of the nature of calculated fields, the value this calculation will display is dependent on the dimensions we drag onto the view. For example, if we add Country to the view, we can find the GDP/Person for Luxembourg is $108,972.
If we then break down the GDP to the level of Country/Year, we find that the GDP/Person in Luxembourg is $111,913 in 2011, $103,859 in 2012, and $111,162 in 2013.
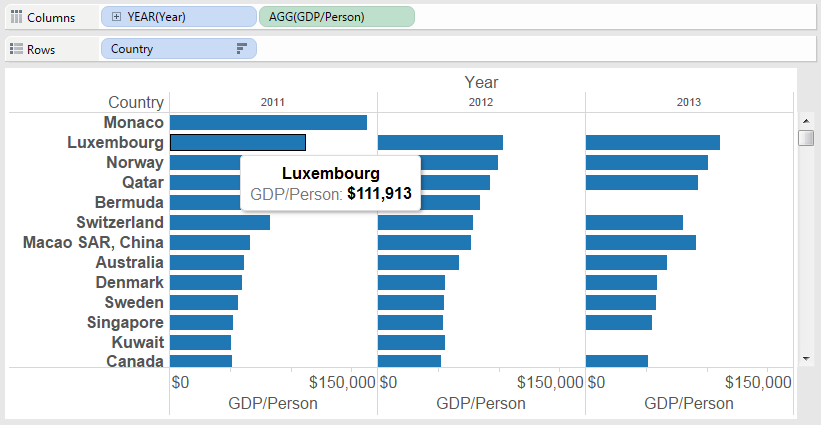
Notice that none of these values are the same as the first value we found for Luxembourg’s GDP/Person ($108,972). That’s because we’ve changed the “Level of Detail” of the view and added a more granular dimension of Year!
With LOD Expressions, you now have the ability to control the exact level at which you’d like to compute the calculation—no matter the dimensions placed on the view. Having this ability unlocks an entirely new scope of questions that we may ask of our data.
Why (and How) should you use an LOD Expression?
If you take a look at your “Tableau Toolkit” you likely have tools such as: Calculated Fields, Table Calculations, Show Me, and many other methods/tools to use when exploring your data. An LOD Expression is meant to be another tool in your toolkit, not to replace all other tools.
LOD Expressions allow you to answer new questions that traditionally used to be complex or “hacky” to answer in Tableau. If I had a dataset recording all World Cup Champions, I could ask the question: What is the first year Germany won? This question is easy enough to ask, but before Tableau 9.0, it was deceivingly hard to answer.
Let’s take a look at the Viz of the Day from April 9th, 2015 on the Player History at the Masters by Rob Harrison. This is a great job of analyzing the Masters champions from a number of different angles. In fact, you can use this viz to answer questions such as: what score wins the Masters? Which country has the most champions? How has the winner’s share changed over time?
All of these are great questions. Using LOD Expressions, we can dive even deeper into the data and ask more questions. Such as: For those champions who have won more than one tournament, when did they first win?
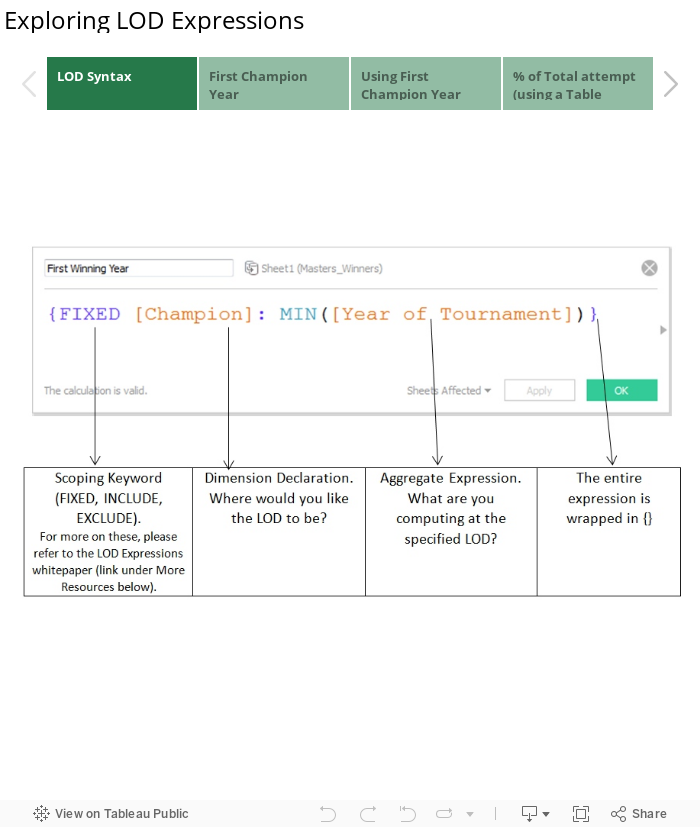
Explore the story below to learn about the syntax of LOD Expressions as well as a few helpful use cases. Feel free to download the workbook and see if you can reverse engineer some of the LOD Expressions!
More resources
If you’d like to learn more about LOD Expressions, please refer to this awesome content:
- The Top 15 LOD Expressions
- Using LOD Expressions (whitepaper)
- LOD Expressions On-Demand Training Video(s)
- Online Help (great for syntax questions)
Download Tableau Desktop Public Edition 9.0 to start exploring for yourself!
เรื่องราวที่เกี่ยวข้อง

Iron Viz 2026: Read Between the Data
 May 28, 2026

Tableau's Iron Viz Winners

Explore the 2026 Iron Viz Entries
 ธันวาคม 15, 2025