How self-service analytics ‘caught fire’ across Southwest Airlines



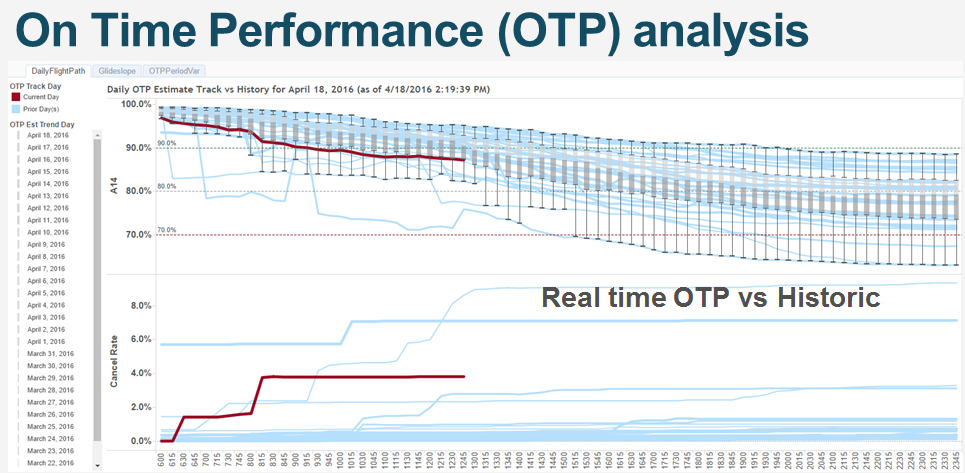
With a fleet of more than 700 airplanes operating 3,500 flights a day, Southwest Airlines has a lot of data.
“We’ve got data on planes, customer interactions, airports, and etc. So if you can think of the different dimensions that I have to play with—the analysis, the forecasting—it kind of blows your mind,” says Tom Laney, a Business Consultant in the Data Science Center.
But getting a full picture of the data hasn’t always been easy. Data existed in silos across the company. Not everyone had access to the same data, which often resulted in multiple sources of truth.
People were manually pulling data from whatever sources they could. They were analyzing that data in Excel then sharing findings via PowerPoint. Insights usually came in the form of monthly reports, and people couldn’t easily build on each other’s work. There was a lot of duplication and a lot of data discrepancies.
To get everyone on the same page, Tom and his team needed a self-service data-integration tool. And they’d heard great things about Tableau.
“We saw Tableau as more than just a great visualization tool. It can connect to our Oracle database, our SQL database, our Teradata database, and Excel all in the same place—I mean, are you kidding me!” says Tom.
Southwest started with just a handful of Tableau Desktop licenses, but that number quickly grew.
“As soon as we began sharing our dashboards, word began to spread,” says Tom.
Other teams began calling, asking about this tool that would not only connect to multiple data sources but also allow people to explore the data for themselves in real-time.
‘You choose the question and up pops the Tableau dashboard’
Among those who called was the Technical Operation Fleet Reliability Group. The department provides insights on maintenance and engineering—crucial information for managing the health of Southwest’s fleet of Boeing 737s to the highest standard.
The team utilizes data generated by Flight Operations, Ground Operations, Inflight, and Technical Operations as well as digital data straight from the aircraft onboard-monitoring system captured in real-time.
Data is a crucial piece of the team’s planning and strategy, and Excel and PowerPoint weren’t quite cutting it. The team needed a more powerful analytics tool to find answers at the speed of business.
“We had to do something different because our leadership was calling for more information on demand versus the we’ll-get-it-to-you-in-a-week approach,” says Troy Roskop, Manager of Aircraft Reliability on the Maintenance team.
Troy and his team had heard about other teams’ successes with Tableau, so they decided to give it a try. And the tool quickly “caught fire,” says Troy.
“Within about four months, I had a full deck of people that can use Tableau like it’s no one’s business,” says Troy.
Using governed data sources provided by IT, analysts authored interactive dashboards and embedded them in Southwest’s web portal for easy access.
“Anyone can get on it. And there’s a great menu that helps you ask any kind of maintenance question. You choose the question and up pops the Tableau dashboard with the answer that someone has built,” says Troy.
People no longer had to wait to ask for answers. They could drill down to the data in real-time and see each airplane’s maintenance history. And with everyone looking to the same set of dashboards, the whole team subscribed to a single source of truth.
“Tableau has really made our world more precise and standardized. We used to live in a world without having something that could give real-time answers. As a result, leaders would have to wait on the team to process Excel and build a PowerPoint before being able to make decisions. Now, they have the tool that gets them the answers they need when they need it,” says Troy.
The dashboards have also replaced monthly PowerPoint reports, which took an analyst two full days each month to prepare. Now, instead of creating a new report every month, the analyst simply refreshes the data to update the dashboard.
“The efficiency gained is huge; my team spends less time building PowerPoints presentation and more time making an impact with the analysis they can do,” says Troy.
“The multiplication factor is just huge in terms of time and work efficiency,” says Tom.
‘People now feel the value in themselves’
When Tom and his team first tried Tableau four years ago, they started with just three Tableau Desktop licenses.
Many teams like Troy’s have joined since. These days, Southwest has 300 Tableau Desktop users and 1,100 Tableau Server users in 28 departments. People across the company share and collaborate using 2,000 published workbooks. And IT enables self-service analytics at scale by providing trusted data and a secure environment in which to explore the data.
“IT has enabled us to build these mini-production areas. Now we have the power to really answer the questions and do the analysis,” says Tom.
The impact of this approach has been profound, says Tom. With data no longer in silos, teams can connect the dots to see a full picture of their data. And with the ability to ask and answer questions at the speed of thought, people can spot opportunities and help move the business forward.
“It’s like giving you a flashlight, and you’re able to look at the corner of that dark room that you’ve never been able to see before,” he says.
“It’s really driven us to be an even greater data-driven company,” says Troy. “We can get the information so quickly. We can drill down and share our findings with people who are making decisions.”
Then there’s the unexpected effect, says Troy. With what used to take days now taking just seconds, Troy has noticed a boost in morale.
“People now feel the value in themselves because their work makes a greater impact on the company,” says Troy. “It’s that proud feeling you get from knowing you’ve really made a difference. And you can’t get there until you have the right tool in place.”
เรื่องราวที่เกี่ยวข้อง
How EMD Serono is improving patient care with personalized, AI-powered insights from Tableau
 กันยายน 30, 2024

Embedded Analytics: Should you build or buy?
 มิถุนายน 7, 2022
Data fabric’s value to the enterprise
 May 11, 2022