How the COVID Tracking Project built one of the most widely used coronavirus datasets of the pandemic


The team behind the COVID Tracking Project did not expect to be here right now.
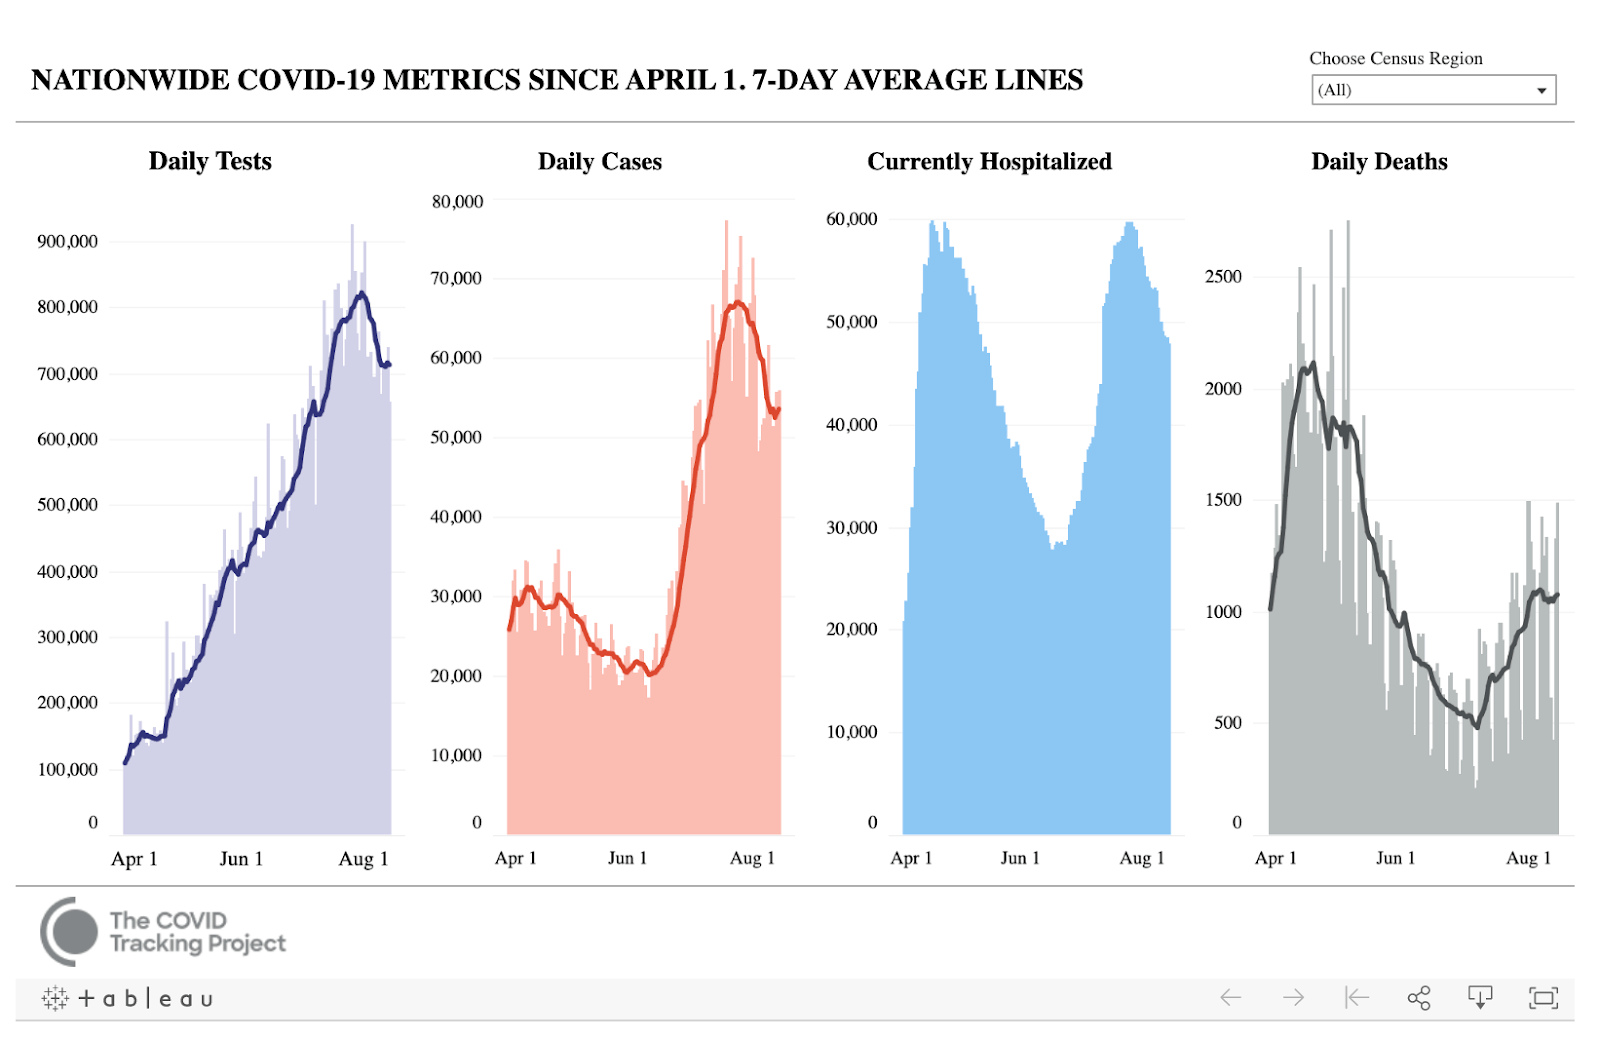
If you’ve been following the evolving data on the coronavirus in the U.S., you’re probably familiar with the COVID Tracking Project. Every day, they publish the latest numbers on tests, cases, hospitalizations, and patient outcomes from all 50 U.S. states and five territories, and visualize this data in Tableau. They’ve also begun tracking COVID data by race and ethnicity—an effort that’s proved critical to understanding the disparate impacts of the virus.
In the U.S., it’s been over half a year since the virus materialized, and the work that the COVID Tracking Project is doing is essential for understanding its spread. Their data has been cited by the White House, the CDC, numerous state governments, and all across the media.
But when Tableau sat down to chat with Erin Kissane, the project’s managing editor, she said that initially, the team did not anticipate how long term—and vital—this project would become.
The effort launched organically in early March, after two journalists at The Atlantic, Robinson Meyer and Alexis Madrigal, built a tracker investigating lagging COVID-19 testing rates. Separately, Jeff Hammerbacher, Founder and General Partner at Related Sciences, had built a tracking spreadsheet of his own. They joined up on March 7 and made a call for volunteers to help source data, and that’s when Kissane joined as managing director. Absent any comprehensive data collection and sharing efforts from the federal government, the growing team was pulling numbers from wherever they could—state public health data tables, press conferences, Tweets, Facebook posts, and anywhere else data were shared. “We expected we’d be updating the data for a few days–maybe a week—until the federal data emerged,” she told Tableau. “It never did, but we’re still here.”
Since that time, the COVID Tracking Project has been building the most accurate record it can of data related to the coronavirus, and has amassed a large cohort of volunteers and an advisory board of public health experts to drive the work forward. Tableau talked to Kissane about why this effort is so important, how they get it done, and how this substantial data project has grown over time.
The need for reliable, real-time data
COVID-19 has shone a spotlight on the need for a centralized, accurate, and up-to-date data source to understand the virus and how it’s spreading. The COVID Tracking Project team notes that while many other countries have implemented widespread testing and data collection strategies to contain the virus, the U.S. has lagged behind on testing and data sharing. The CDC has published data on confirmed cases, Kissane says, but when the COVID Tracking Project team compared their data from the states to what the CDC is reporting in May, they found substantial mismatches. Those mismatches, Kissane says, were due in large part to the federal government conflating viral and antibody testing, which was later reported by the COVID Tracking Project’s cofounders in The Atlantic. “If we hadn’t been that deep into the state-level data by that point, that error might not have been discovered for a long time,” she says.
Even though data on COVID-19 seems straightforward—a matter of collecting information on cases, deaths, and hospitalizations—it’s much more complicated than that. The definition of a positive case can vary from one confirmed by a laboratory test to one that’s probable on the basis of symptoms and exposure. Some states won’t count a death as COVID-related if the person did not have a laboratory-confirmed test. And because hospital systems all report their own data, it can be difficult to collect a full picture.
The COVID Tracking Project, Kissane says, works to be as thorough as possible in explaining the data, how they source it, and if and when they introduce errors into the process, and if there are errors present in the data they pull from. “This is messy data,” Kissane says. For instance, Florida’s testing rates dipped recently due to a hurricane, and California recently disclosed that their state IT system that collects reports from labs has not been catching all the test results the labs have sent. “They don’t know how much data was missed, but they expect that once they’re able to account for it, they’ll be able to scoop it up from their spreadsheets and that will affect their positivity rate and understanding of the outbreak,” Kissane says. Essentially, doing this work is like hitting a constantly moving target. “Our function is to annotate the data and explain what’s happening as best as possible, and also produce a state-based dataset that can be used to provide accountability,” she says.
Collecting and sharing COVID-19 data by race
The COVID Tracking Project has also been instrumental in meeting another critical need for data around the pandemic: Almost as soon as COVID-19 hit, it became clear that the virus was disproportionately impacting people of color in the United States. But data on COVID by race and ethnicity was inconsistent and hard to come by.
Starting in April, the COVID Tracking Project partnered with the Center for Antiracist Research—which takes a data-driven and research-based approach to developing strategies for dismantling racism—to develop the COVID-19 Racial Data Tracker. This dashboard contains information from every state on what percent of COVID cases and deaths have been reported with race and ethnicity data. While nearly every state reports race/ethnicity data for cases and deaths, that was not always the case—and the Racial Data Tracker clearly shows that few states are hitting the goal of 100% reporting in this area.
“Even with the incomplete data that we do have, we see that in many parts of the country the pandemic has disproportionately affected different groups,” Kissane says. “So the big data science challenge for the COVID Racial Data Tracker is figuring out how to convey what we know, while also conveying where the ambiguities are so great that you shouldn’t trust the numbers. How can we flag and annotation so that it’s clear that in a state that only gives us race and ethnicity data for 10% of the cases, we don’t have enough data to really make any claims.”
Because there are still significant gaps in the data, Kissane says that part of the aim of the Racial Data Tracker is to create accountability for states to improve the amount of race and ethnicity data they provide with COVID data. “Getting data is required to move policy,” she says. “We've certainly been applying pressure as much as we can, but we don’t have the authority to make anyone change reporting practices,” noting that public visibility can highlight opportunities for improvement.
A volunteer led, data-driven effort
What does it take for the COVID Tracking Project team to stay on top of this constantly shifting, complex data landscape? According to Kissane, a monumental, dedicated, and nonstop effort.
Currently, the COVID Tracking Project has around 300 to 350 active volunteers, who all go through an orientation process to learn about the process and the culture around the work. Every day, a cohort of around a dozen volunteers, under the guidance of several shift leads (people who have been working with the project for a long time) do a first pass at the process of collecting data from the states. “Most of it comes from state websites and dashboards—some are in Tableau or ArcGIS or other platforms,” Kissane says. “We still get some numbers from press releases and conferences, if the dashboard doesn’t update.” The volunteers will often have to manually enter the data they find into COVID Tracking Project’s spreadsheet if it’s not available for download.
In their Slack channel, Kissane says, every state gets its own thread, where the first shift of volunteers raise questions and share observations and compare notes with the “double checkers”—more experienced data entry volunteers who essentially repeat the process to verify the work. The volunteers will make notes about issues with the data they identify—from changes in reporting processes to data definitions—so they can share that out to the public with the data. “It’s an extensive annotation process,” Kissane says. To conclude, the team will do a quality assurance check, often using Tableau to visualize the data to see if anything is standing out as unusual. “At this point, we’re so intimate with the data that we can kind of eyeball and say, ‘Oh, that that shouldn't be happening in Hawaii, for example, because that's not their pattern,” Kissane says. Once the process is done, they officially release the data and put notes on Twitter.
While this daily “data run,” as they call it, is the core of their work, that’s just one of their shifts. Other groups of volunteers are constantly working on data upkeep—essentially doing backfill from states that have gaps in reporting. “We’ve been able to beg them for the CSV files so we can update,” Kissane says. And twice a week, teams of volunteers work specifically on collecting data on COVID rates by race and ethnicity for the COVID Tracking Project’s Racial Data Tracker.
What comes next
Even though Kissane and the whole COVID Tracking Project team did not expect the initiative to extend this far, “we’re in it for the duration,” she says. The team of volunteers will continue to update data from the states daily, and track the availability of race and ethnicity data. Currently, the COVID Tracking Project is working with a consortium of other COVID-related organizations to develop a set of data standards that states can follow to ensure that their data is comparable. “We hope that will help, but it’s still not the same as explicit guidance. That said, even when the CDC has released guidance encouraging states to report both confirmed and probable cases, some states have chosen to disregard it because it makes their numbers look higher than they want them to look,” Kissane says. In addition to an invaluable resource during the pandemic, the COVID Tracking Project is also an object lesson in the fact that good data is not a given: it has to be produced, maintained, analyzed, standardized, and constantly reassessed. COVID Tracking Project shows just how essential that process is, and how much work needs to go into it.
As the work is only intensifying, Kissane is hopeful that the project could be brought under the wing of a research institution. “It’s clear that the pandemic is not going anywhere, and our team has been sprinting for months and months working on these complex data issues,” she says. “Ideally, we’d be able to get more support from an institution or foundation that can help us take on these really crunchy epidemiological database problems and create resilience and stability over the project for the long-term.”
See the COVID Tracking Project’s dashboards here.
For more on the importance of data to the fight against the pandemic, visit Tableau’s COVID-19 Data Hub.
เรื่องราวที่เกี่ยวข้อง
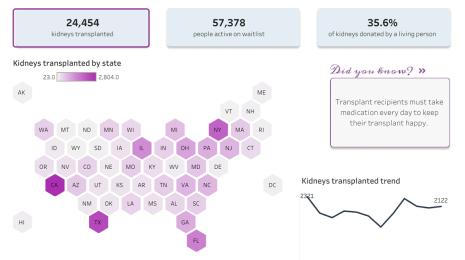
From Kidney Donation to Tableau Dashboard
 ตุลาคม 25, 2022

Using data to drive conversations about climate change
 เมษายน 28, 2022