Analytics for anyone, anywhere, with any data: a TC20 product roadmap recap


We’ve updated this post since yesterday to include more exciting features we announced during Devs at Desks! Unless otherwise specified, the capabilities from our product roadmap shown during TC20 are anticipated for future releases throughout 2021—so stay tuned!
Tableau product innovation is driven by our mission to help people see and understand data. Using data to inform decision-making helps people and organizations adapt to change—and 2020 has proven that we need data-driven resilience more than ever before. We’re excited to show you what our teams have been working on to enable more speed, empowerment, and a complete picture of your data.
Chief Product Officer Francois Ajenstat kicked off our Tableau Conference-ish product keynote by highlighting a few of the most impactful of the 200+ new features and capabilities we've delivered in the last year, including data modeling, Metrics, and Prep write to database. For the remainder of the keynote, and during our Devs at Desks session, Tableau product experts gave us a peek at how their teams making the platform even more engaging, secure, and powerful for users of all kinds. Let’s look at the highlights.
Increasing analytics engagement
Today, organizations with a strong Data Culture are performing better than those without. And as more people adopt analytics, it's important to have relevant data and content readily available in their day-to-day workflows. Ellie Fields, Senior VP of Engineering, highlighted how new features in Tableau are enabling exactly that.
- Redesigned notification center: Now subscriptions, alerts, shares, and comments are consolidated in a richer feed—and directly actionable.
- Slack integration: People can now see Tableau notifications directly in Slack and jump to live dashboards with a single click to dive deeper in the data.

-
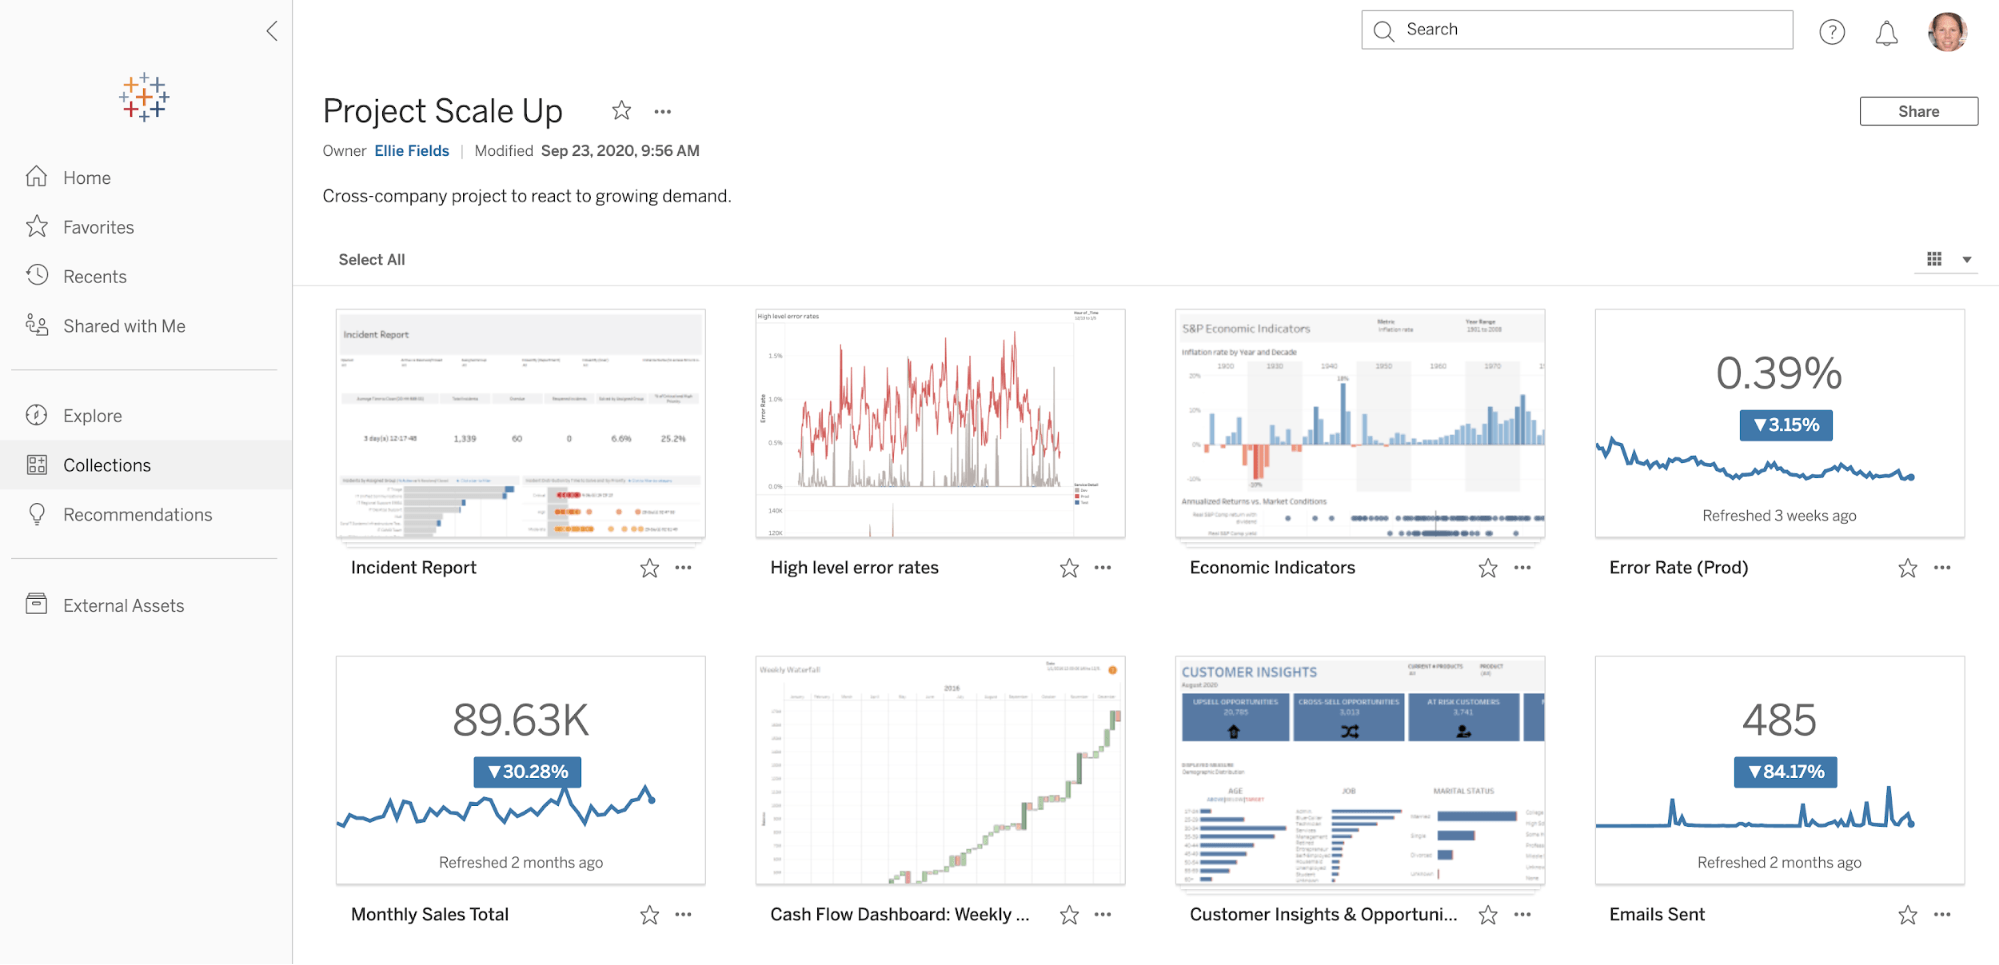
Collections: We’re introducing a new way to help you find, curate, and organize relevant content across different projects in Tableau Server or Online. Now, content can be reused in multiple contexts without duplication. Collections is like a Spotify playlist for your analytics content.
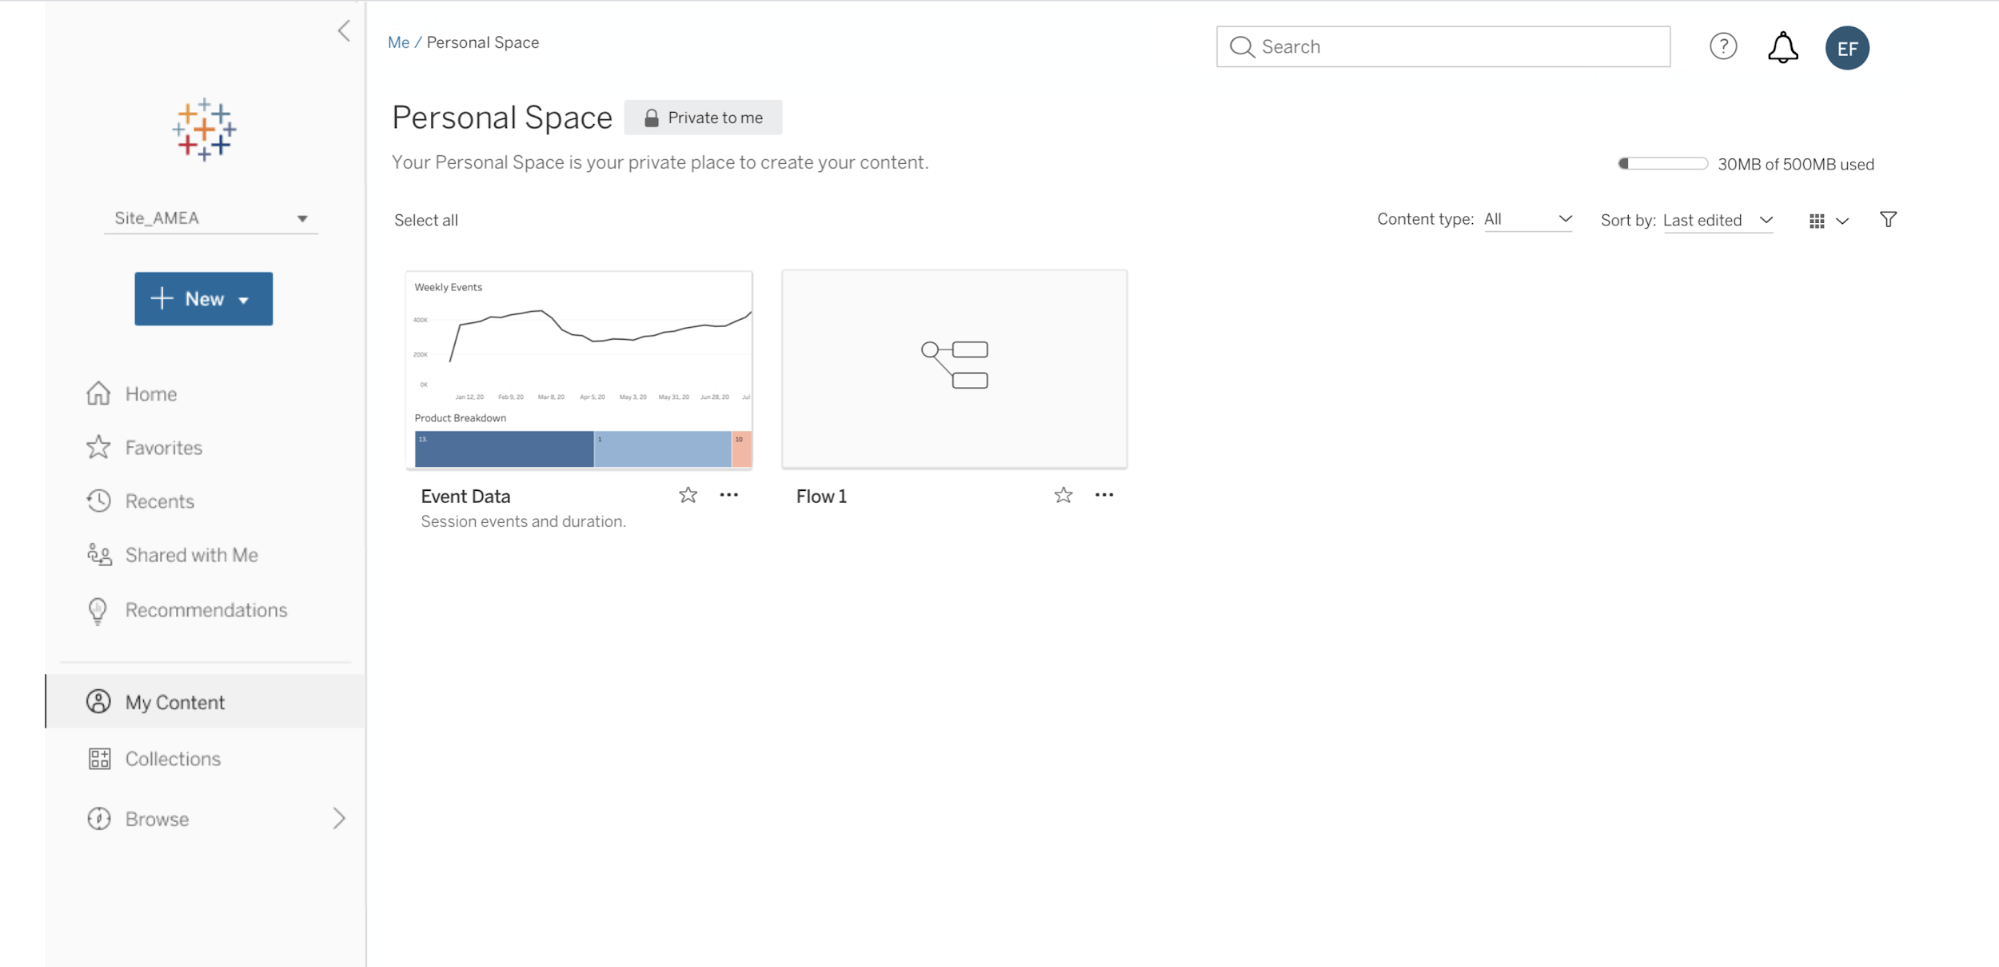
- Personal Space: Like a lock on your office door, you can keep your data and any work in progress private from other users. This helps to govern content that shouldn't be widely discoverable, as well as de-clutter the Server or Online environment.
- Auto-save on the web: While authoring in the browser, you can focus on exploring and analyzing data with confidence that you won't lose your work.
Helping people get up and running with analytics quickly and confidently is also important for engagement. In Devs at Desks, Dorian Schiedt, a software engineer, showed us some enhancements coming to the Tableau onboarding experience.
- Recommendations in site invite: When you receive an email invitation to join a Tableau Online site, you'll see AI-powered recommendations for popular content within that site.
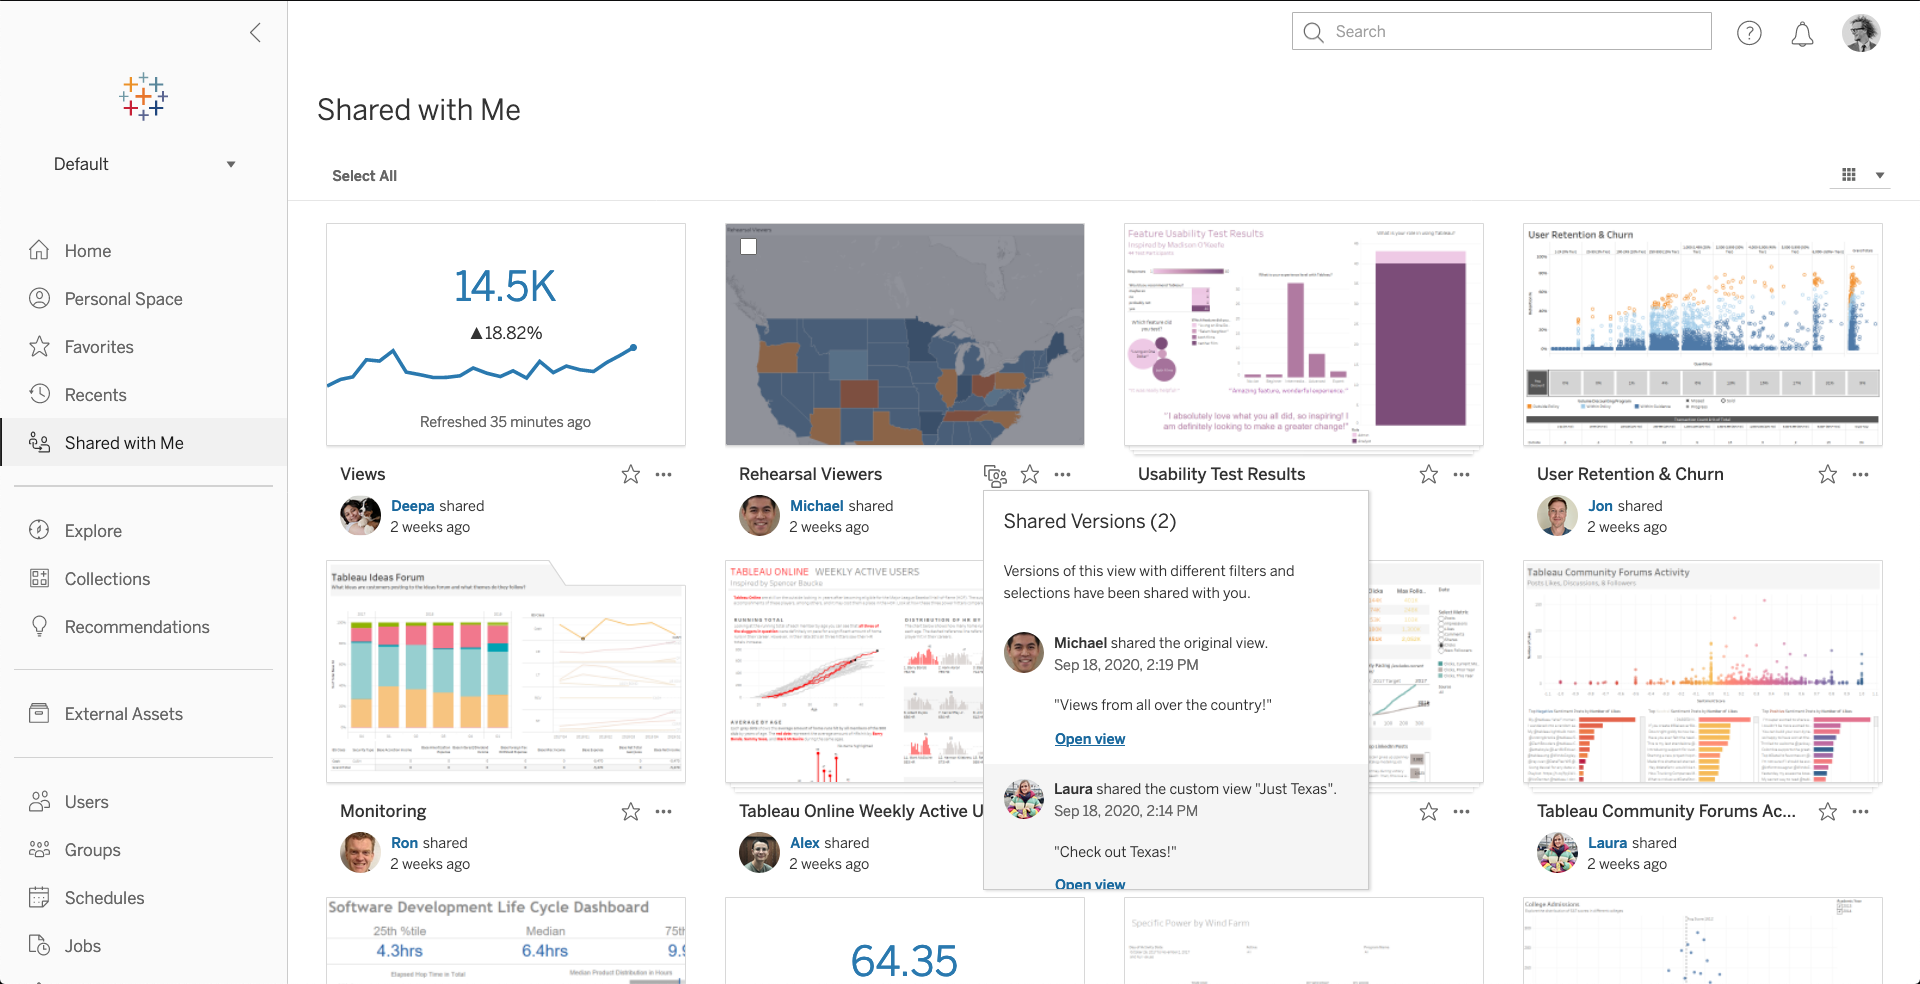
- Shared with Me (2020.3): Once you’re logged in to Tableau Online or Server, you'll see a new, dedicated tab for content that others have shared with you—including custom views.
Improving trust, transparency, and security
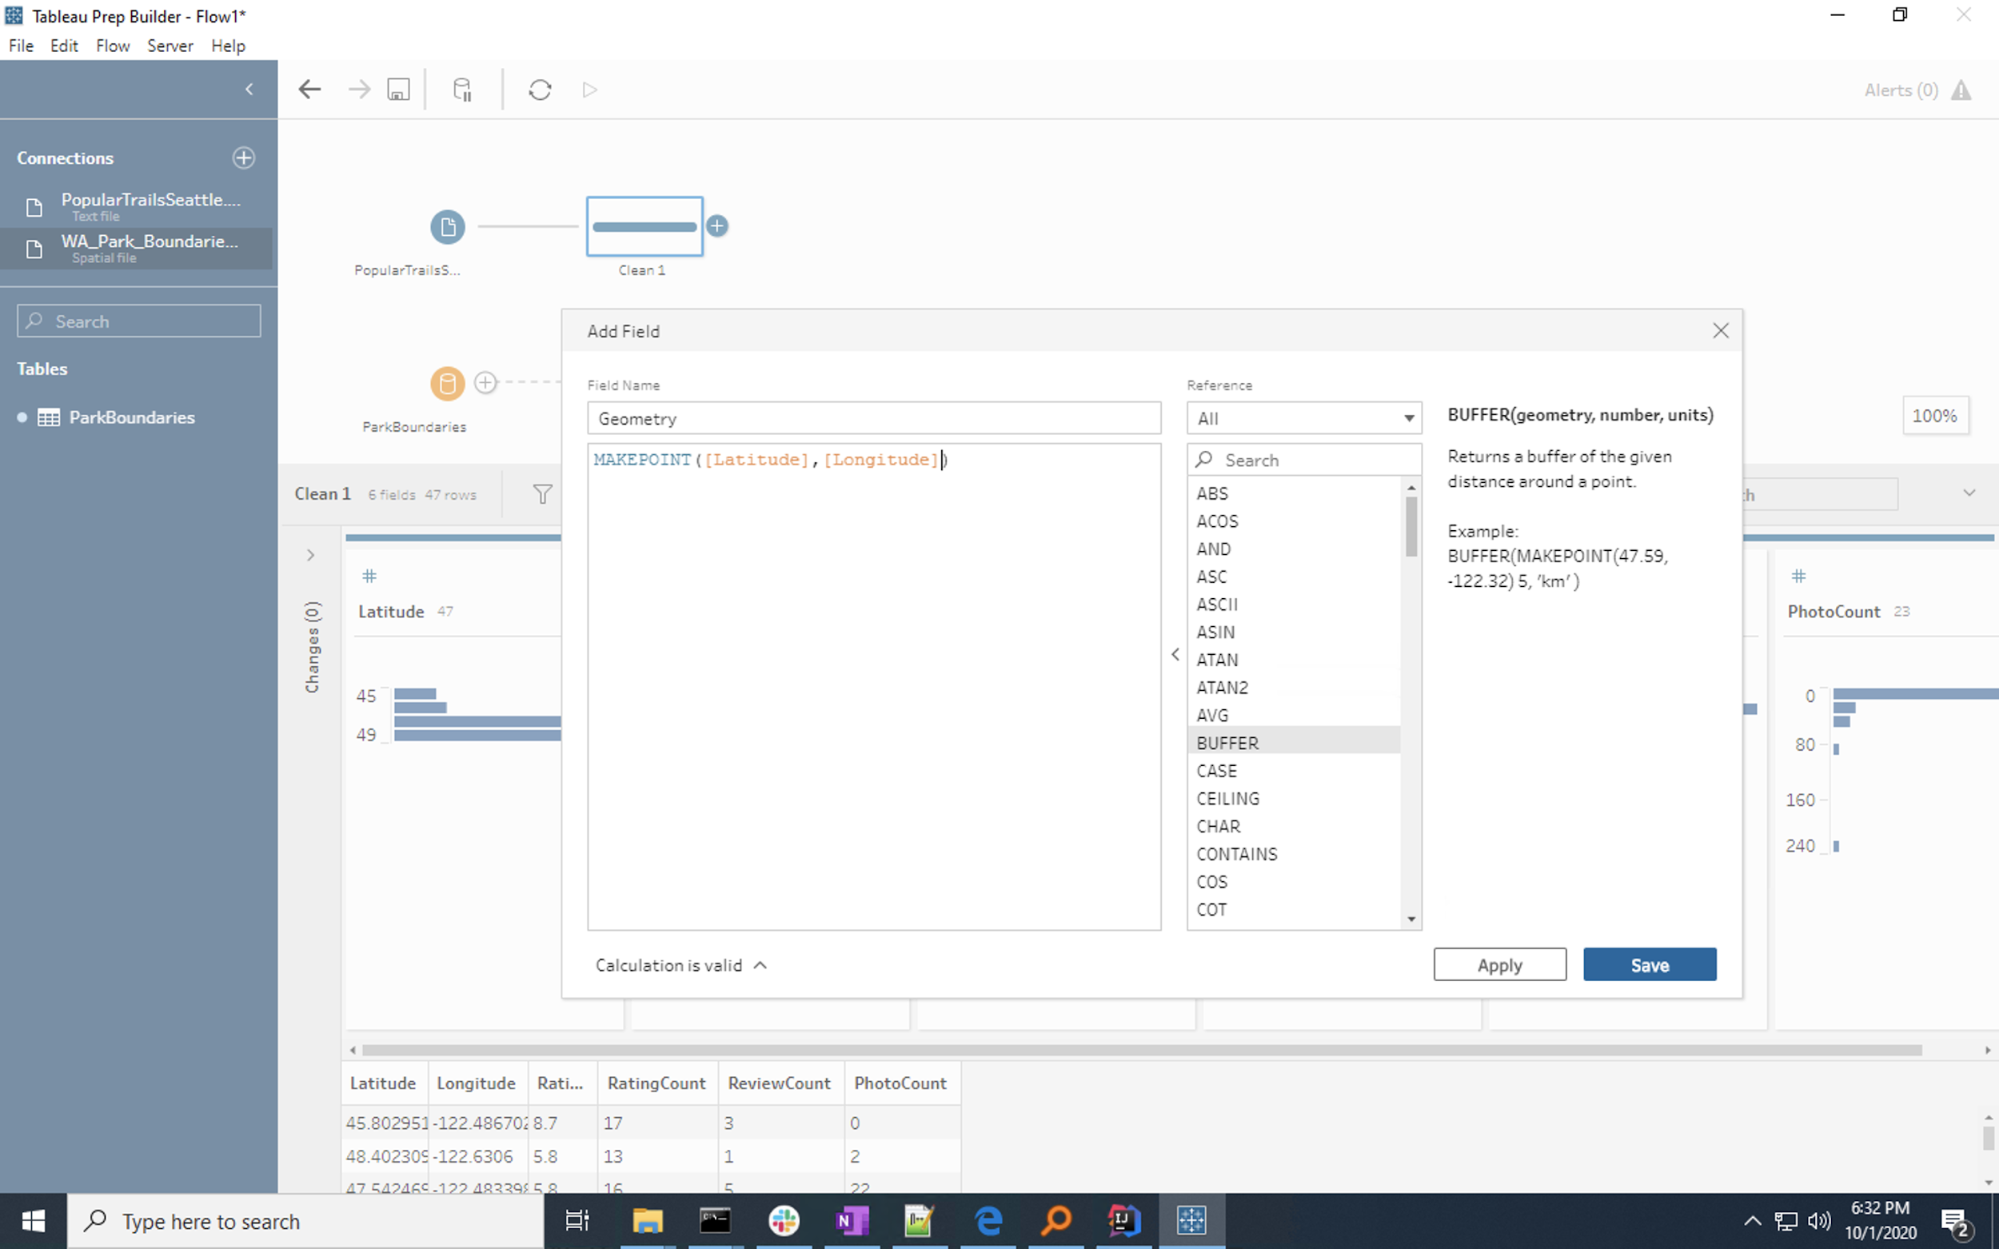
In order for people to trust their insights, they need to be able to trust their data. That’s at the core of our vision for Data Management. To build an analytics environment that enables trust, we need to focus on the right security and governance. Maraki Ketema, a senior product manager, introduced us to some highly anticipated data management features across the Tableau platform.
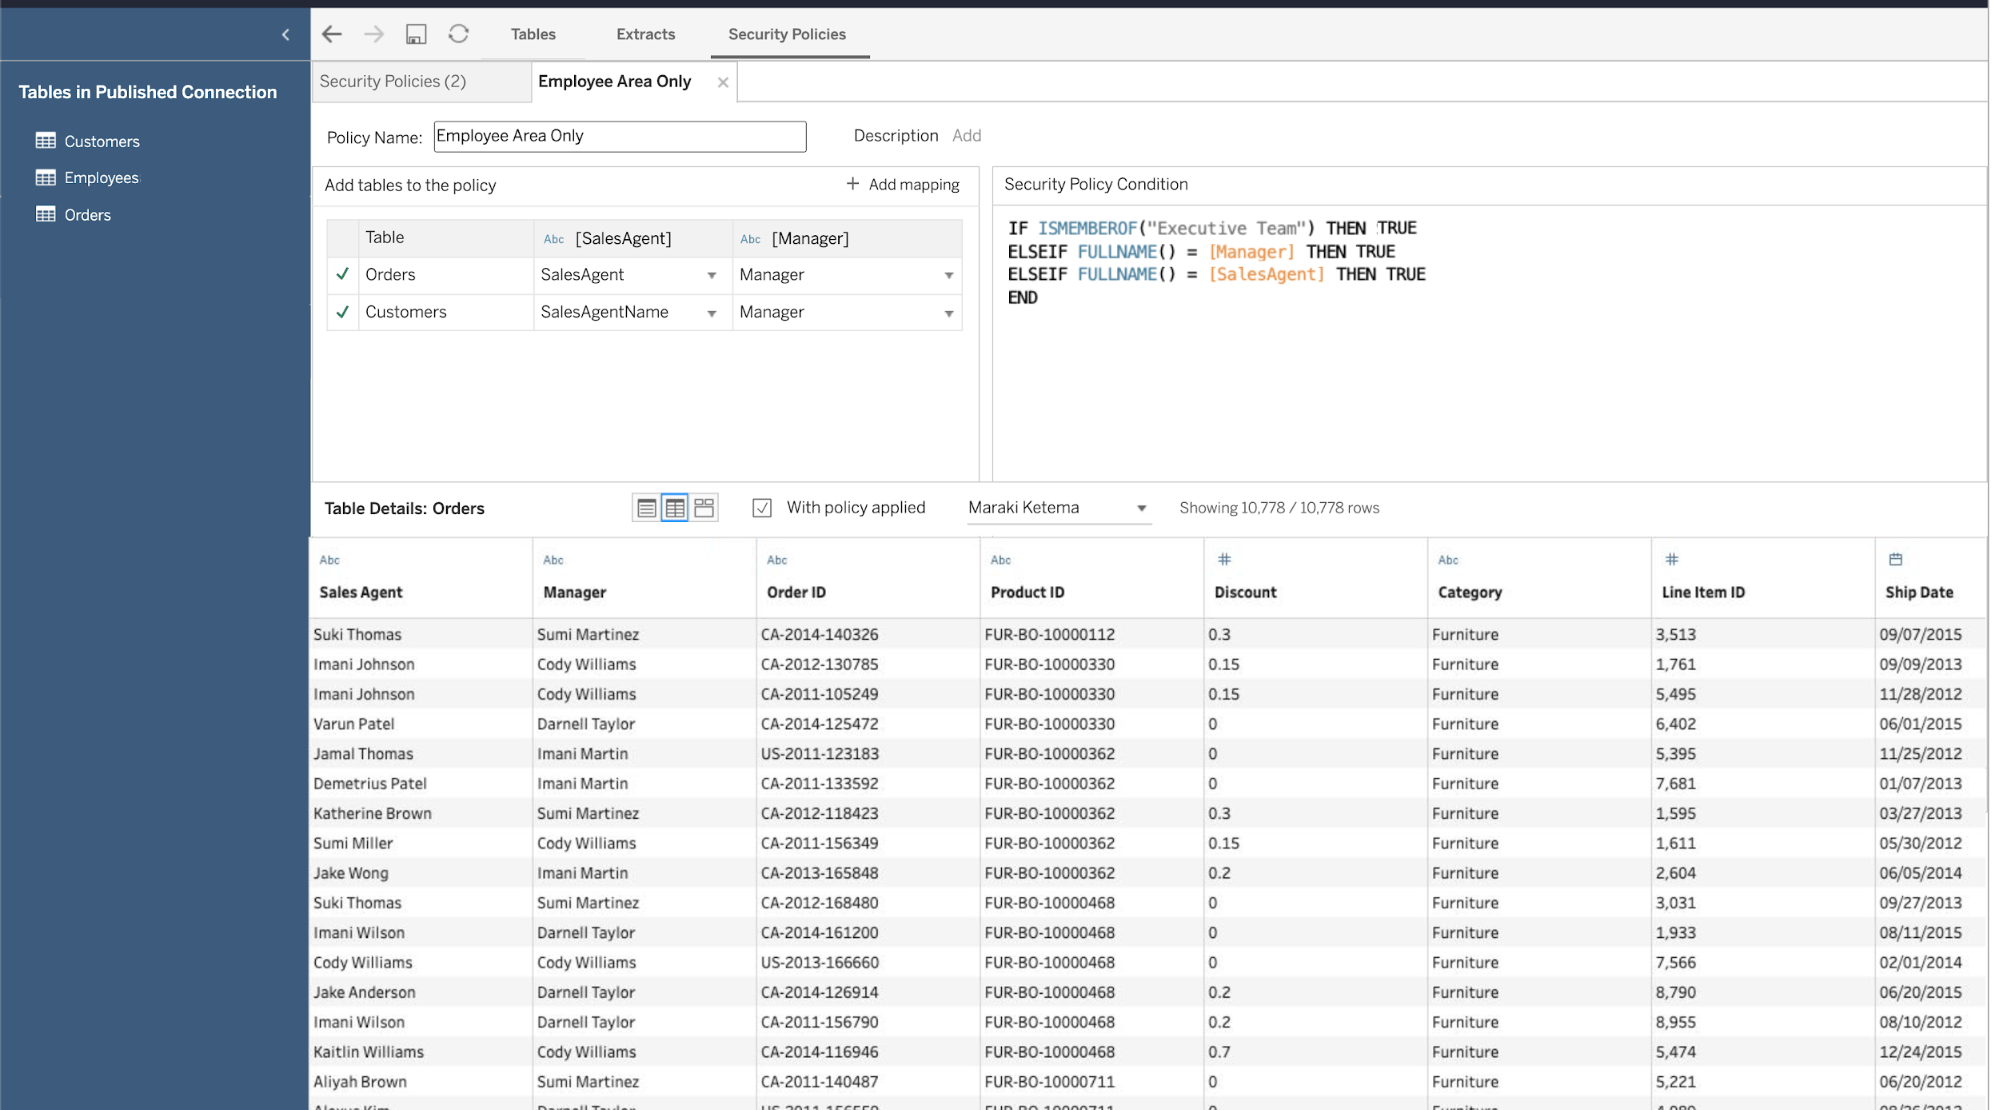
- Centralized row-level security: We’re enhancing Tableau Server and Online security controls with centralized row-level security. This provides a standard way to define security policies and ensure that data is always secured, accessible only by the appropriate people. When setting a security policy, you’ll see a visual preview of which rows will populate for each user.
- Automated data quality warnings: If a prep flow or extract refresh should fail, Tableau Catalog will automatically create a data quality warning to alert anyone accessing downstream workbooks to the data's freshness.
During Devs at Desk, software engineer Azar Rahim Dehaghani dove deeper into some of the functionality we’ve added to Tableau Prep to make data prep easier, more visual, and available to everyone. This includes expanding Tableau Prep to write to external databases, supporting sophisticated transformations via R and Python, and more.
- Prep Builder in the browser (2020.4): 100% of Tableau Prep Builder functionality will be available anywhere, allowing users to prep their data directly on the web.
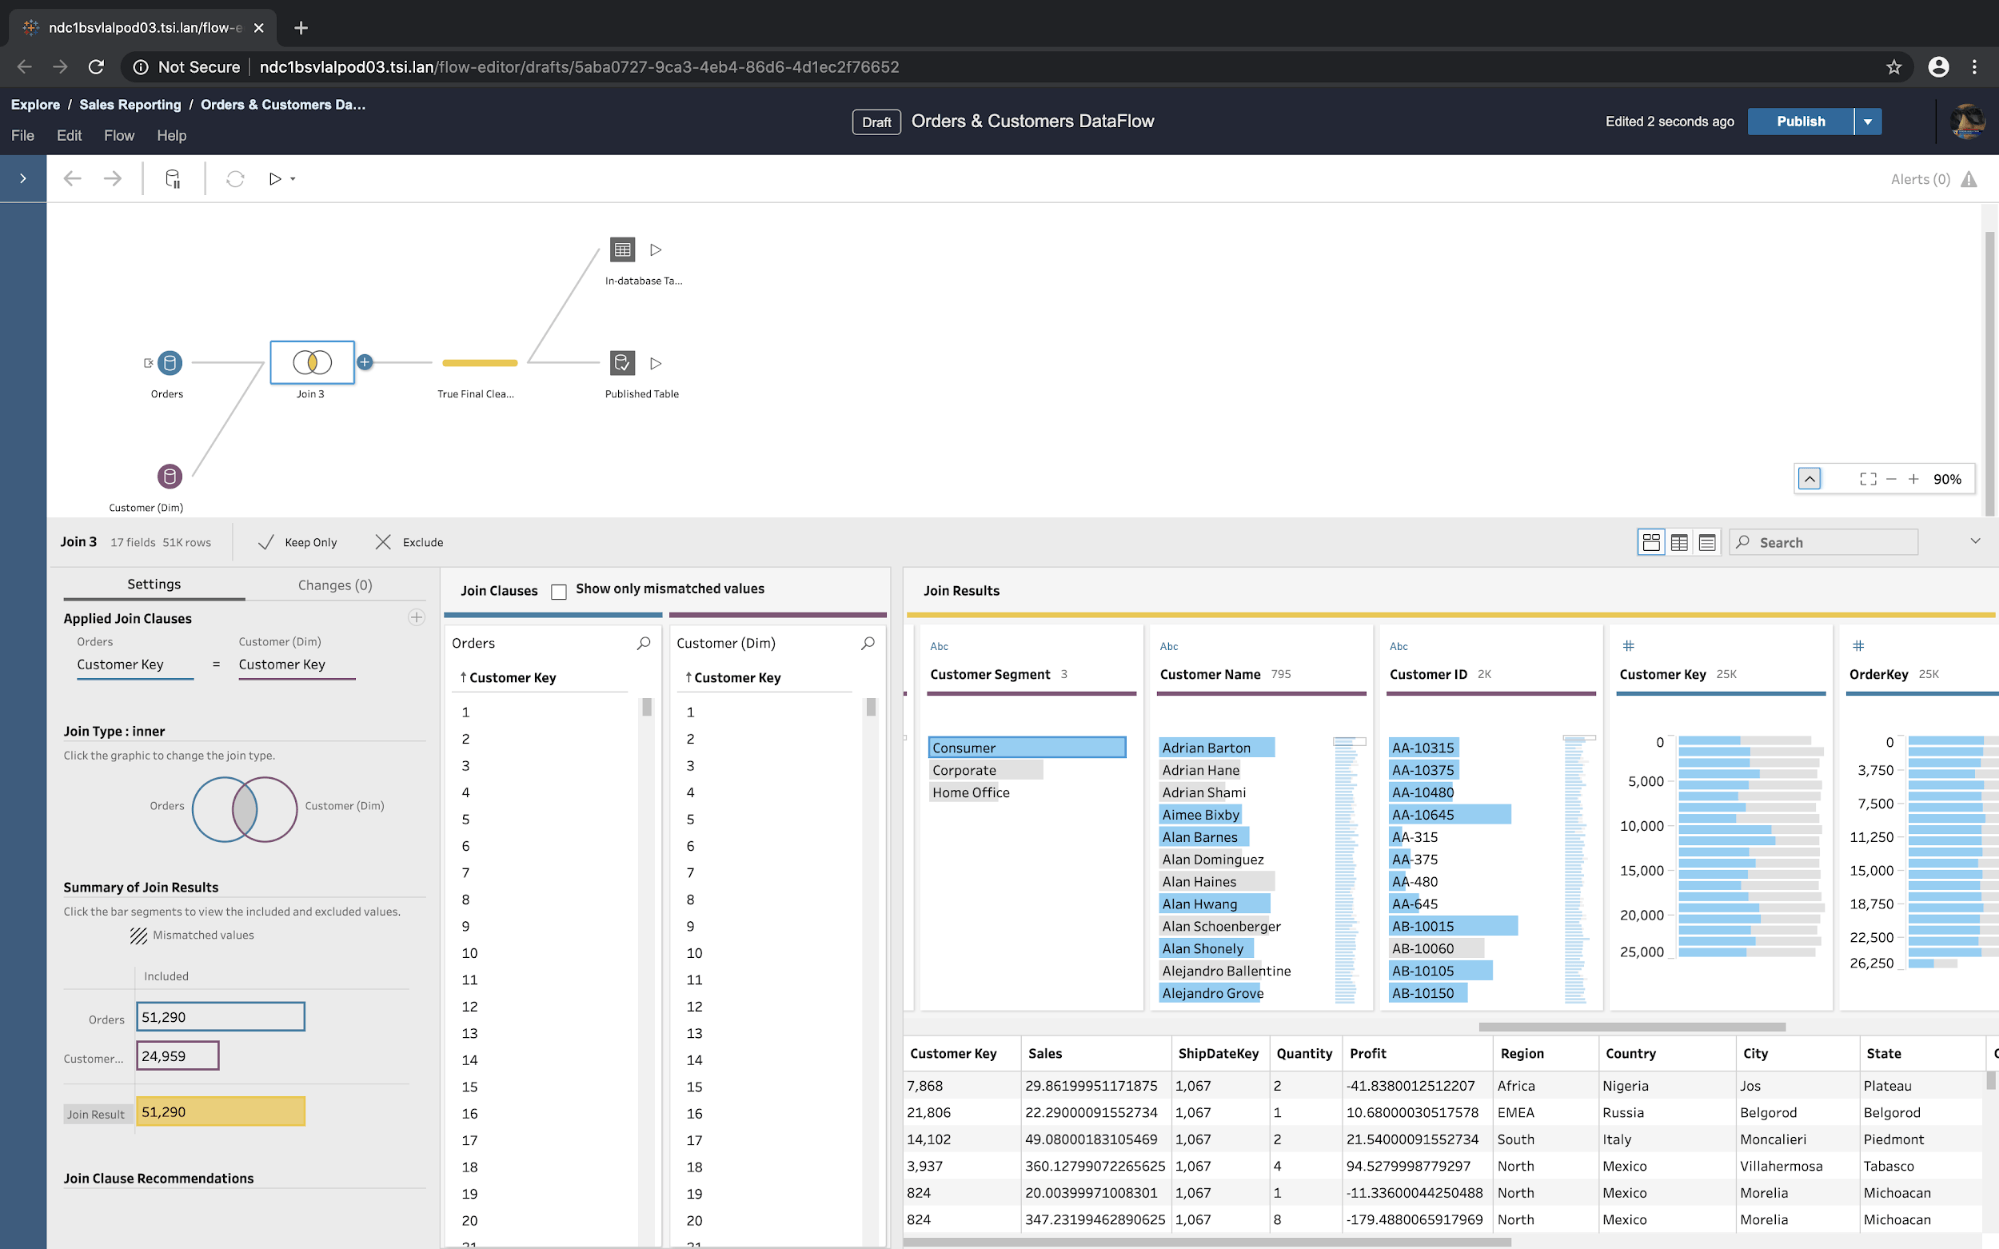
- Spatial support: Tableau Prep will connect to spatial data and perform spatial joins, just like working with any other data. And with spatial calculations, you can more easily find relationships between spatial data and other data when there are related fields.
- Show/hide columns: Show or hide the fields you need during your data preparation. Hidden data remains in the data set for analysis, but is out of sight during prep to allow focus where it’s needed.
- Group steps (2020.3): Combining prep steps together can help you build a flow that meets your mental model or business rules. Expand and collapse groups as you like to stay organized or find the parts of the flow that need action.
And we haven’t forgotten about Tableau Server and Online administrators. Miranda Osterheld, a product manager, demoed some features that help make managing your trusted Tableau environment even smoother.
- Tableau Bridge improvements: Admins can now manage Bridges, modify connections, and track extract refreshes directly from Tableau Online without logging into a Bridge. Additionally, with centralized client management, Tableau Bridge can load-balance extract refreshes for better resource utilization.
- Custom schedules: In Tableau Online, custom schedules for extracts allow owners to tailor refresh schedules instead of relying on what’s set and fixed by administrators.
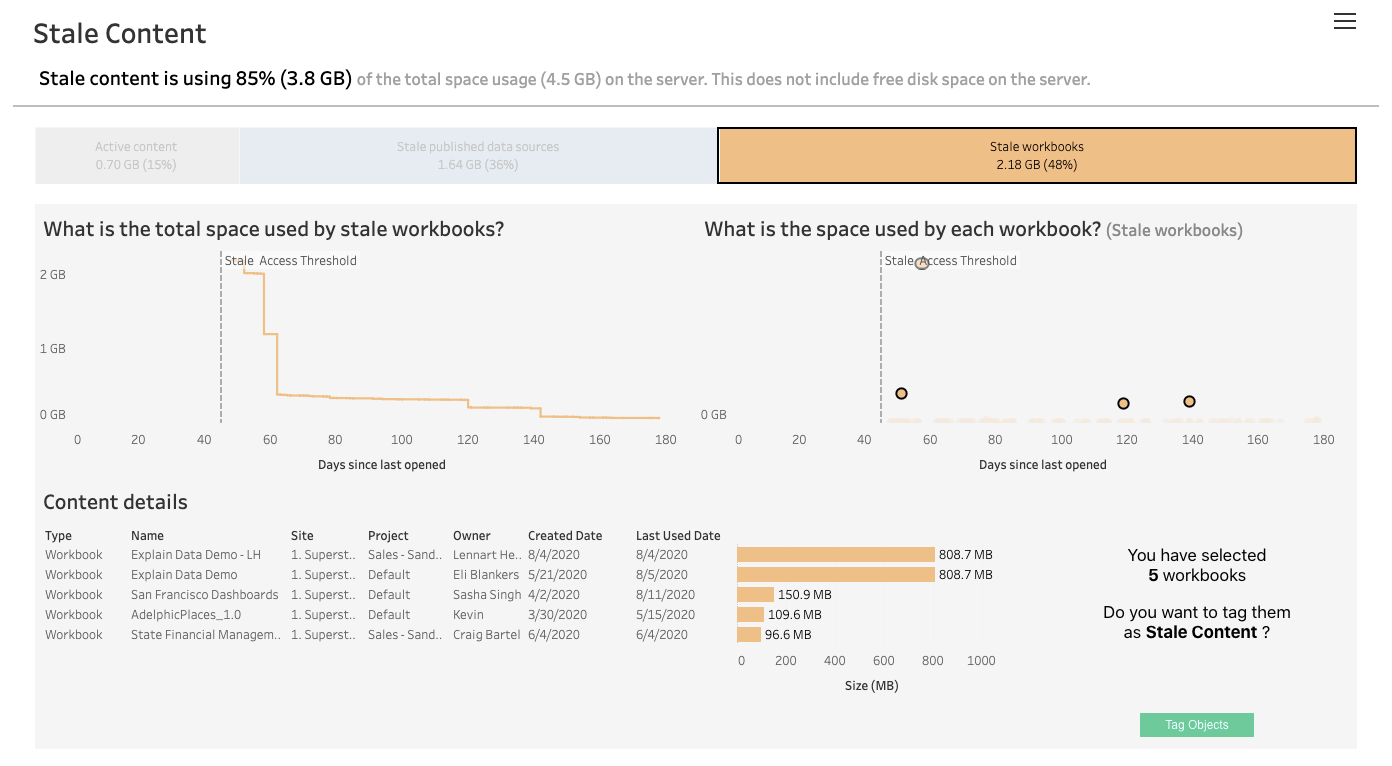
- Stale content admin view (2020.3): Admins can now select and tag content as stale (unused or unaccessed after a specified number of days). Then, stale content can be identified in search to archive or delete, helping relevant content to be more discoverable.
Bringing Einstein Analytics and Tableau together
Our product keynote also included exciting updates from Bobby Brill, a product management director on our Einstein Analytics team, about our efforts to bring together Einstein Analytics and Tableau. Coming in 2021, we are bringing powerful AI/ML capabilities of Einstein Discovery directly in Tableau—in dashboard extensions, calculations, and Prep Builder.
And that’s just the beginning—we’re also working on integrated data management, and content authoring and sharing capabilities. You can read more about these updates as well as our long-term vision in our Tableau and Einstein Analytics post.
Building more powerful analytics capabilities for everyone
In our work to democratize data and analytics, we’re constantly innovating to bring more powerful capabilities to users of all skill sets. This includes introducing new ways for people to interact with their data beyond traditional analysis—like using natural language. In Devs at Desks, Ryan Atallah, who leads the Ask Data team at Tableau, gave us a tour of the biggest Ask Data update since our initial launch in early 2019.
- Redesigned Ask Data interface: The new Ask Data interface combines the speed and flexibility of search with the power and intelligence of NLP. Now it’ll be easier than ever to see how your query is being interpreted, while Ask Data learns from your selections to improve interactions over time.
During Devs at Desk, Filippos Lymperopoulo, an analytics product manager, also showed us some amazing predictive capabilities that will build on what we released this year, as well as some improvements to maps and calculations.
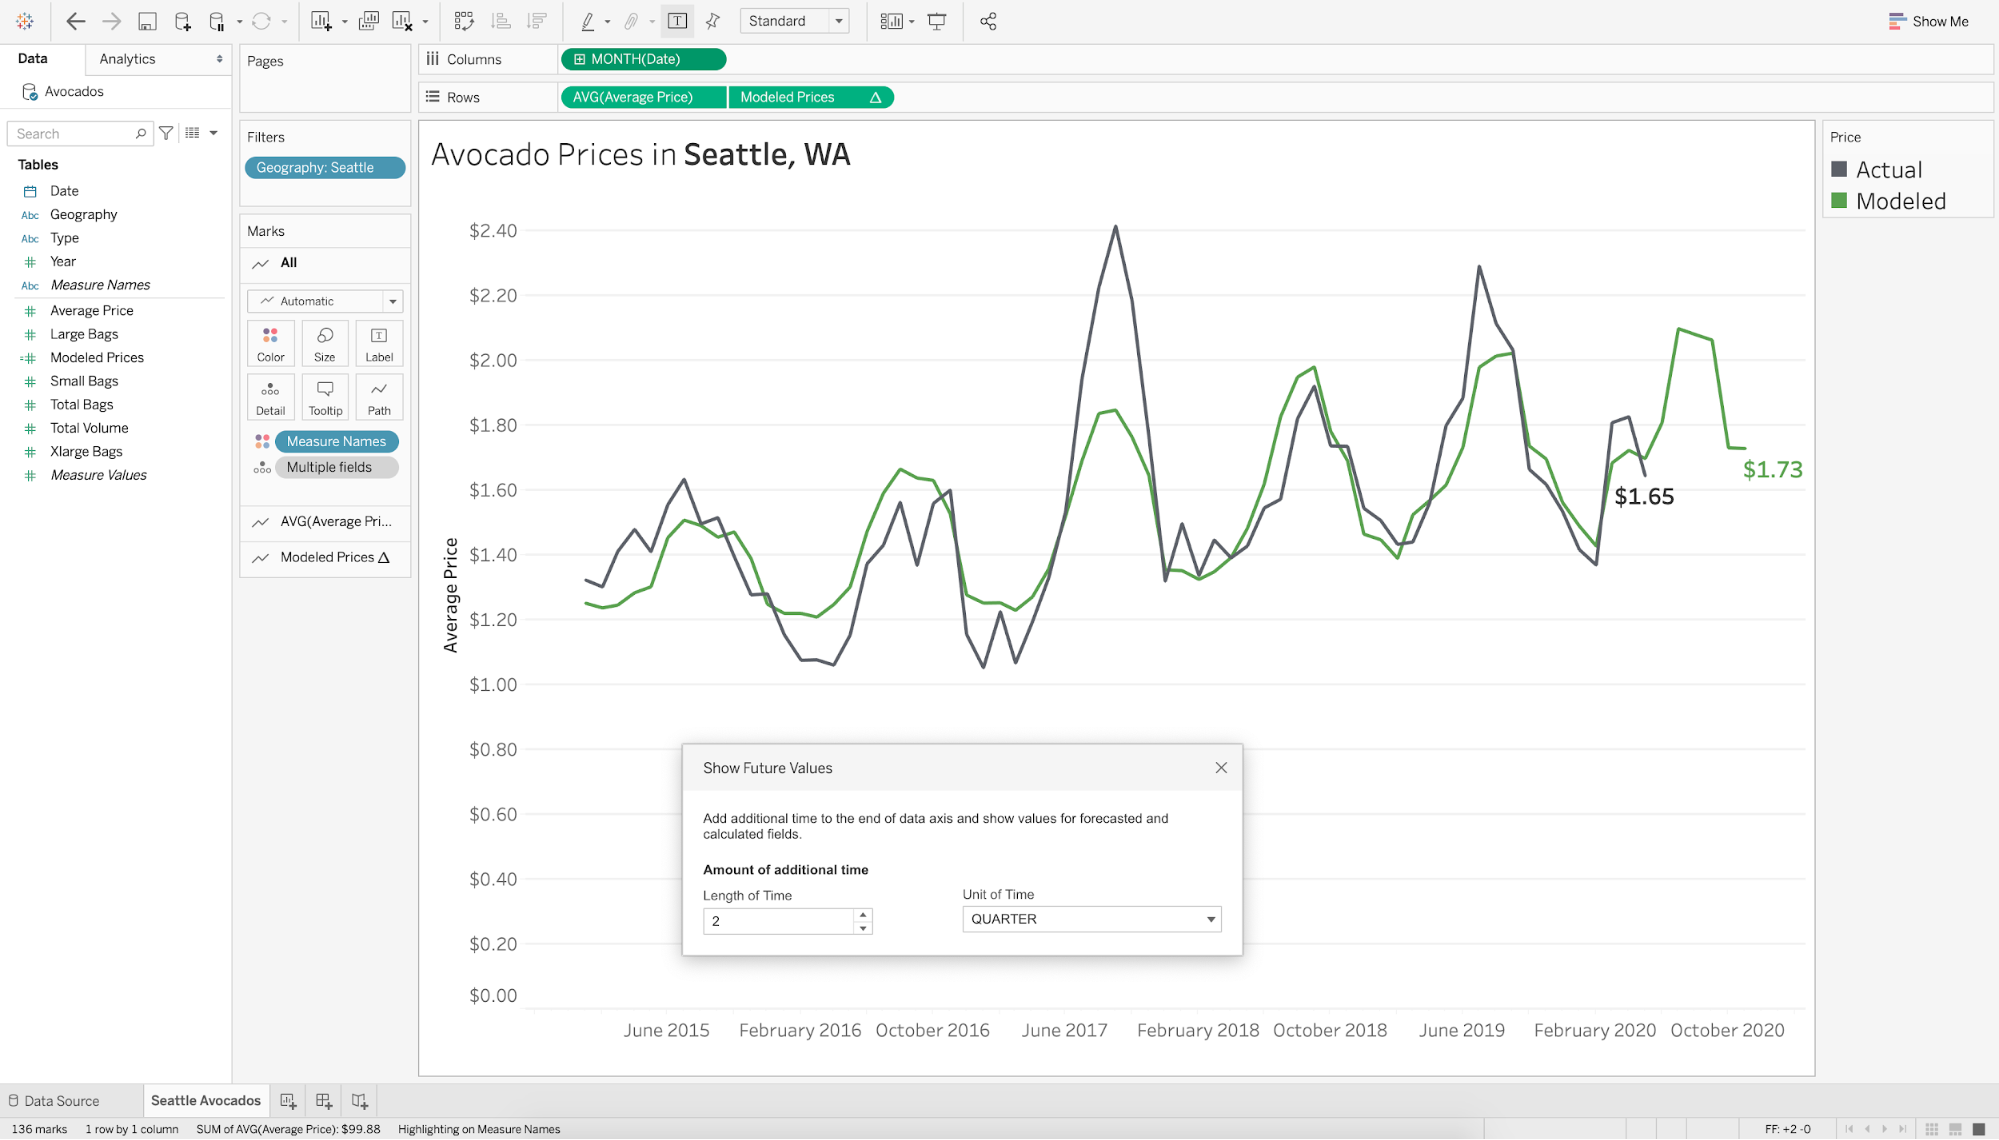
- Date axis extension: With model calculations and analytics extensions, you’ll soon have the ability to extend the date axis beyond the range of the underlying data source—great for forecasting!
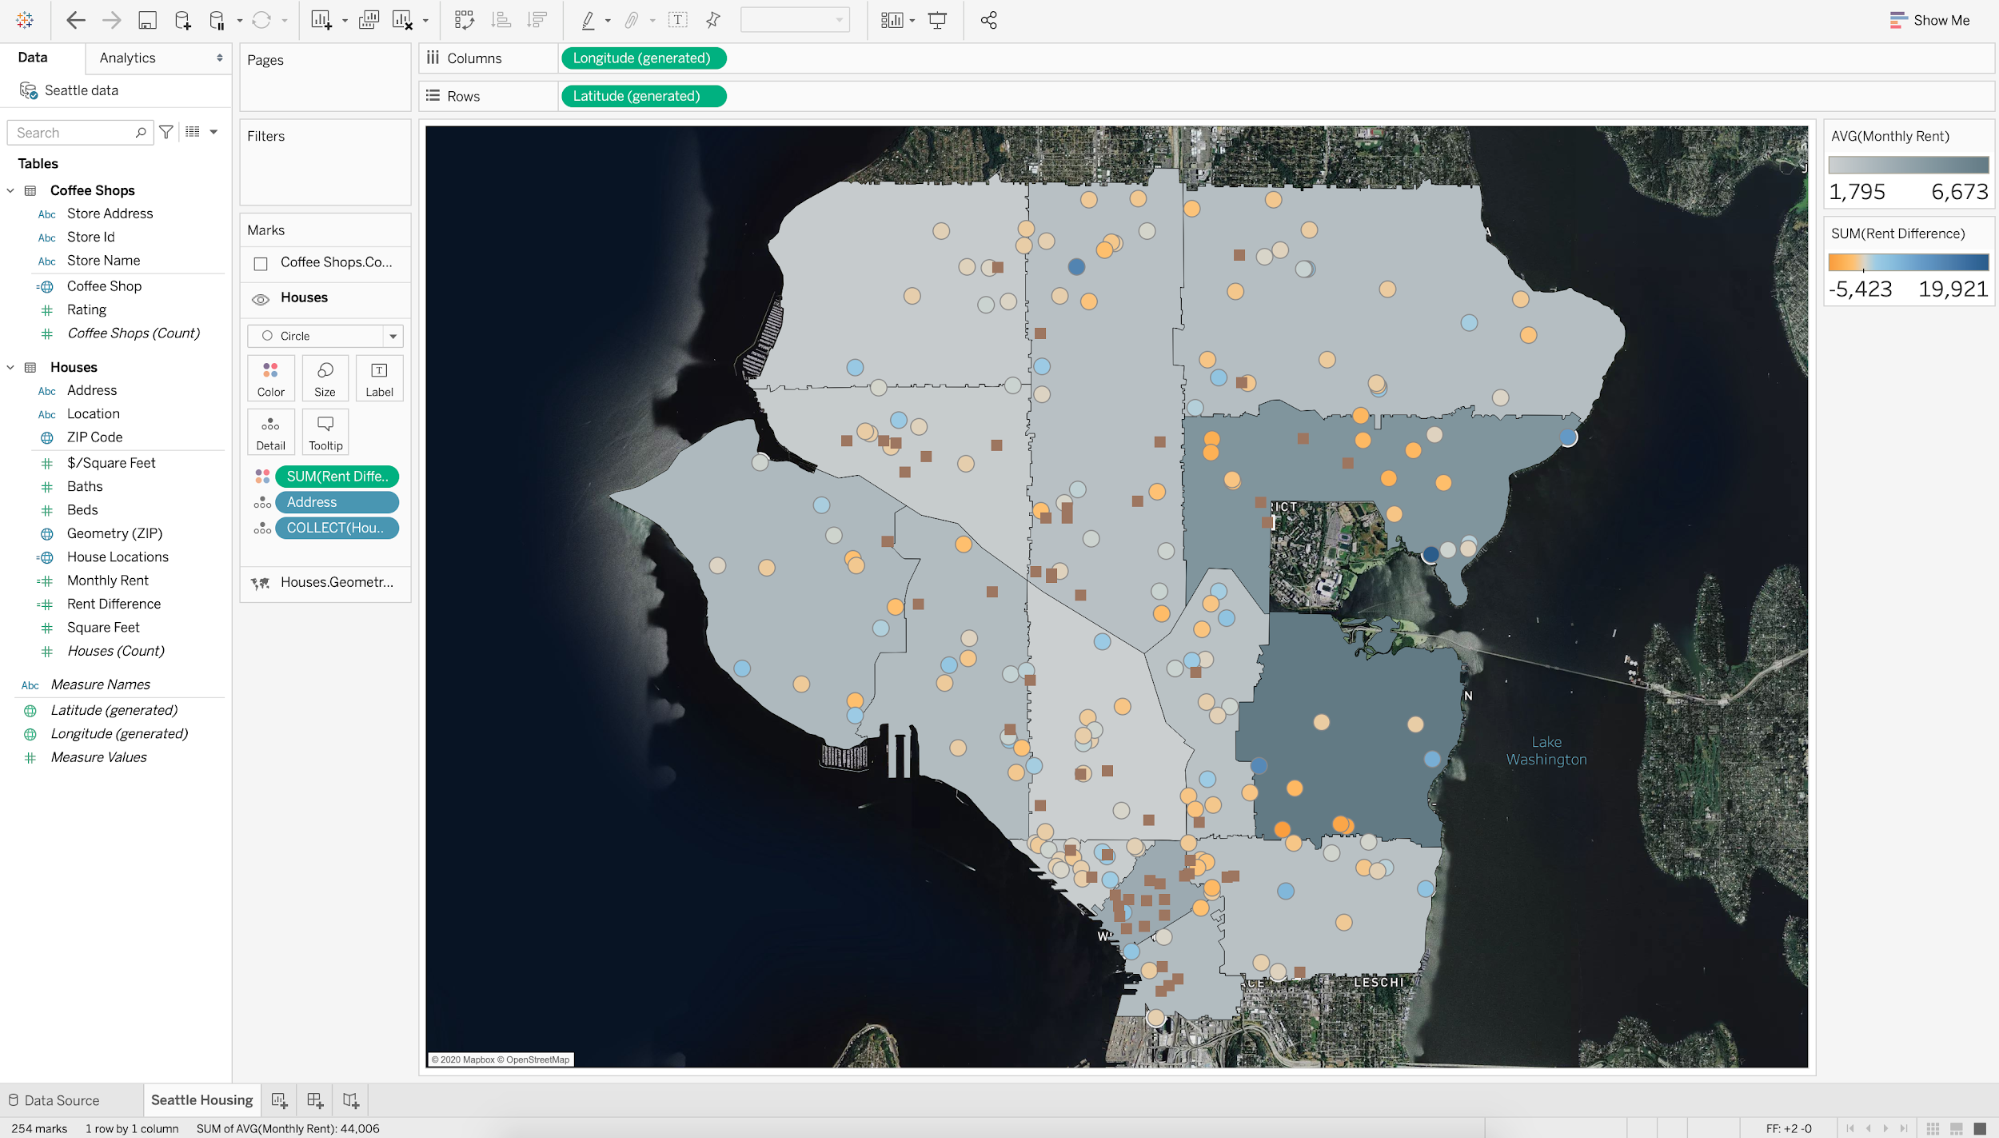
- Multiple mark layer support for maps (2020.4): We’re enhancing geospatial analysis by enabling multiple mark layers in the same view on a map.
- Quick LODs: Create level of detail calculations within your workflow. You’ll simply drag and drop a measure from one table to another, or use the context menu to quickly customize the calculation.
What to watch if you missed these product announcements
We couldn’t cover everything in this post, but don’t fret if you weren’t able to join us live—you can check out some TC20 highlights, and dive into more TC20 sessions on-demand! (Must be registered—it’s 100% free!)
เรื่องราวที่เกี่ยวข้อง

Extend Access to Embedded Tableau Content with On-Demand Access
 กรกฎาคม 22, 2026

The Tableau+ Bundle with Premium AI, Enterprise Capabilities, and Premier Success
 มิถุนายน 24, 2026

What is Tableau Prep?
 เมษายน 30, 2026