เรื่องราว ทั้งหมด
 Data Skills
Introducing learning paths: Sharpen your skills with new role-based learning
 ธันวาคม 9, 2019
We launched role-based learning as part of Tableau eLearning. Consisting of 12 specialized learning paths aligned to Tableau roles across the organization, each role is designed to accelerate the proficiency of your people quickly and effectively.
ธันวาคม 9, 2019
We launched role-based learning as part of Tableau eLearning. Consisting of 12 specialized learning paths aligned to Tableau roles across the organization, each role is designed to accelerate the proficiency of your people quickly and effectively. Best of Tableau Web
Best of the Tableau Web: A look back at TC, the Community, and a fond farewell
 ธันวาคม 6, 2019
In this look back at the last two months of blogs, Andy Cotgreave shares his round-up of the Best of the Tableau Web, including posts that review Tableau Conference 2019, blogs from two Iron Viz contestants about the experience, reflections on the what the Tableau Community means to dozens of members, and more. He also says farewell to Kelly Martin, beloved community member and member of the Tableau Zen Masters Hall of Fame.
 Enterprise
How to build a sales effectiveness program for LinkedIn Sales Navigator with Tableau
 ธันวาคม 4, 2019
With the 2019.4 release, Tableau released a LinkedIn Sales Navigator connector and dashboard starters to improve the productivity and performance of sales organizations. We dive into dashboards that can quickly provide current reporting and analysis, reveal actionable insights into sales activity, and optimize sales performance with this social selling platform. Learn how you can develop a sales effectiveness program with LinkedIn Sales Navigator and Tableau, beginning with the following four dashboards.
ธันวาคม 4, 2019
With the 2019.4 release, Tableau released a LinkedIn Sales Navigator connector and dashboard starters to improve the productivity and performance of sales organizations. We dive into dashboards that can quickly provide current reporting and analysis, reveal actionable insights into sales activity, and optimize sales performance with this social selling platform. Learn how you can develop a sales effectiveness program with LinkedIn Sales Navigator and Tableau, beginning with the following four dashboards.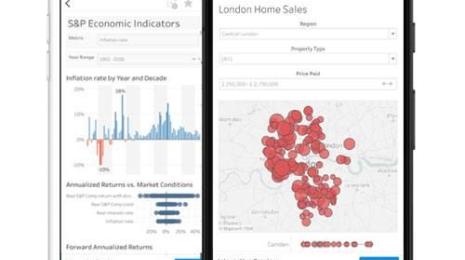 Tips & Techniques
5 tips for mobile-first dashboard design in Tableau
 ธันวาคม 3, 2019
Tableau Visionary Ryan Sleeper shares his tips for creating mobile-first dashboards in Tableau, including how to: determine if you should consider a mobile-first design, scroll multiple sheets at once and eliminate default scroll bars completely, leverage tooltips, and more.
 Data
DataFraud risk expert assesses data climate in government offices
 ธันวาคม 2, 2019
This is part two of a two-part conversation with Linda Miller, a principal at Grant Thornton, where she leads the Fraud Risk Mitigation and Analytics Practice.
ธันวาคม 2, 2019
This is part two of a two-part conversation with Linda Miller, a principal at Grant Thornton, where she leads the Fraud Risk Mitigation and Analytics Practice. Tableau
DataFam meets Trailblazers: The power of data at Dreamforce 2019
 พฤศจิกายน 24, 2019
Check out the highlights from Dreamforce 2019.
พฤศจิกายน 24, 2019
Check out the highlights from Dreamforce 2019. Tips & Techniques
Top 10 Tableau table calculations
Here are 10 powerful examples of Tableau's table calculations. Most require writing a simple formula of some kind. Each example contains a live example and instructions in a tabbed view. You can download any workbook for a deeper look.
 Developer
#Data19 DataDevs hack their way to rockstar status
 พฤศจิกายน 20, 2019
This year marked the fifth year of the #DataDev hackathon, and participants brought their A-game. From creative extensions, to using the Hyper API, to bringing CSVS into Tableau, to dynamic filters, our DataDevs used their coding skills and creativity to battle it out for our annual code championship.
พฤศจิกายน 20, 2019
This year marked the fifth year of the #DataDev hackathon, and participants brought their A-game. From creative extensions, to using the Hyper API, to bringing CSVS into Tableau, to dynamic filters, our DataDevs used their coding skills and creativity to battle it out for our annual code championship. Data
DataFraud risk expert assesses data climate in government offices
พฤศจิกายน 18, 2019
This is part one of a two-part conversation with Linda Miller, a principal at Grant Thornton, where she leads the Fraud Risk Mitigation and Analytics Practice. Iron Viz
Iron Viz 2019 sliced and diced food data to a flavorful finish
พฤศจิกายน 17, 2019
Andy Cotgreave shares the highlights from Iron Viz at Tableau Conference 2019.
 Developer
Devs on Stage dazzles: Dynamic Parameters, Noodles, and Animation are simply the best
 พฤศจิกายน 14, 2019
Catch up on what you missed this #data19! Dive into what is coming to Tableau from Devs On Stage—everything from animations to Tableau Server tools to dynamic data, and more.
พฤศจิกายน 14, 2019
Catch up on what you missed this #data19! Dive into what is coming to Tableau from Devs On Stage—everything from animations to Tableau Server tools to dynamic data, and more. Tableau
Empowering a Data Culture to drive change at Tableau Conference 2019
 พฤศจิกายน 13, 2019
This morning in Las Vegas we kicked off our 12th annual Tableau Conference—our biggest yet, with data rockstars from all over the world! Read on for Adriana Gil Miner's recap of Opening Keynote highlights.
พฤศจิกายน 13, 2019
This morning in Las Vegas we kicked off our 12th annual Tableau Conference—our biggest yet, with data rockstars from all over the world! Read on for Adriana Gil Miner's recap of Opening Keynote highlights.