Working faster and smarter during hard economic times
Customer Profile
Business Support Services (BSS) is one of the four support business units in the City of Charlotte and is comprised of four divisions all working to support the mission of “advancing the business of public service.”
Customer Case Description
During the last two years, analysts in the City of Charlotte’s Information Technology Division (BSS/IT) have found that using visual analytics can lead to better service to customers. Traditionally, however, BSS/IT used a combination of Excel and a team of sophisticated programmers to analyze data and create reports for the City’s various departments. But these reports proved to be extremely time consuming to create and difficult to understand—the team would spend days creating reports that provided only minimal value to its customers.
Reports that previously took days or weeks to create are now completed within minutes or hours. Now we can spend more time digging into the data and identifying outliers, trends and exceptions to the norm.
The Solution
In order to extract more value from its data, the BSS/IT department deployed Tableau’s visual data analysis software. Through a combination of Tableau Desktop (for data analysis, visualization and reporting) and Tableau Server (for department-wide collaboration, sharing and dashboarding), BSS/IT was able to increase performance by up to 20x.
“Reports that previously took days or weeks to create are now completed within minutes or hours,” said Jim Raper, manager of data administration for the City of Charlotte. “Since deploying Tableau, we’ve been able to do more ad-hoc analysis. The solution enables us to start with the end result instead of spending hours querying databases and writing code. Now, we can spend more time digging into the data and identifying outliers, trends and exceptions to the norm.”
After a year of using Tableau, Raper and his team wanted to expand the benefits gained from Tableau to other departments within the City. In order to promote the value of Tableau’s unique analytical capabilities and streamline the disparate analytical processes across various government departments, BSS/IT organized and sponsored a Business Analysis Olympiad, inviting employees from across the City’s 14 Key Business Unites to use Tableau to analyze a set of sample data. The analyses created by 12 two-person teams were judged on their business-decision value, quality and format. The winners took home free Tableau software and other prizes.
“We wanted to promote Tableau as a tool that would enable our Key Business Units to significantly enhance the efficiency of their data analysis processes and the quality of reports they produce,” said Raper. “The event was a success, and it opened a lot of people’s eyes to the value of visual analytics in making timely and important business decisions. During these hard economic times, the ability to work smarter and faster is of extreme value, and Tableau allows us to do just that—spend less time on the process of creating reports and more time gaining important insights from the data itself.”
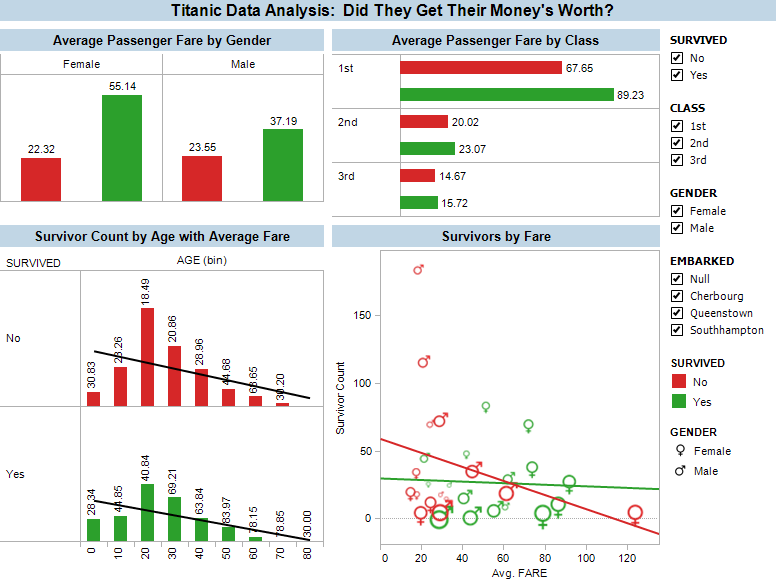
Here’s one of the visualizations created at the Business Analysis Olympiad, on the survival rates of the Titanic:
For More Information About This Case
Contact: visualanalysis@tableau.com or call (206) 633-3400 x1