Create Professional Graphs

Try Tableau for Free

Full-version trial. No credit card required.

See for yourself how speed, scale, and innovation come standard with Tableau.

Fast Analytics

Connect and visualize your data in minutes. Tableau is 10 to 100x faster than existing solutions.

Ease of Use

Anyone can analyze data with intuitive drag & drop products. No programming, just insight.

Big Data, Any Data

From spreadsheets to databases to Hadoop to cloud services, explore any data.

Smart Dashboards

Combine multiple views of data to get richer insight. Best practices of data visualization are baked right in.

Update Automatically

Get the freshest data with a live connection to your data or get automatic updates on a schedule you define.

Share in Seconds

Publish a dashboard with a few clicks to share it live on the web and on mobile devices.

You have data and you have questions about that data. You know that there is a chart or graph out there that will help answer your questions, but it is not always easy to know which chart or graph is best without some trial and error.

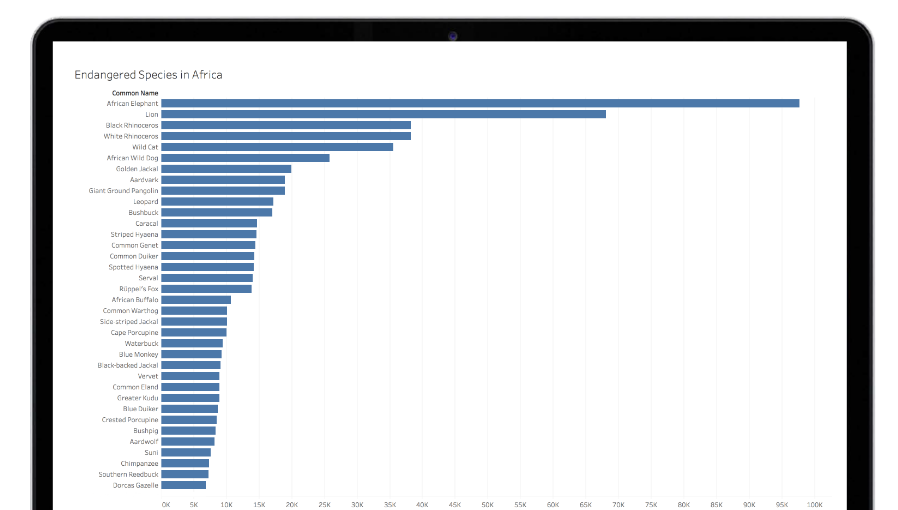
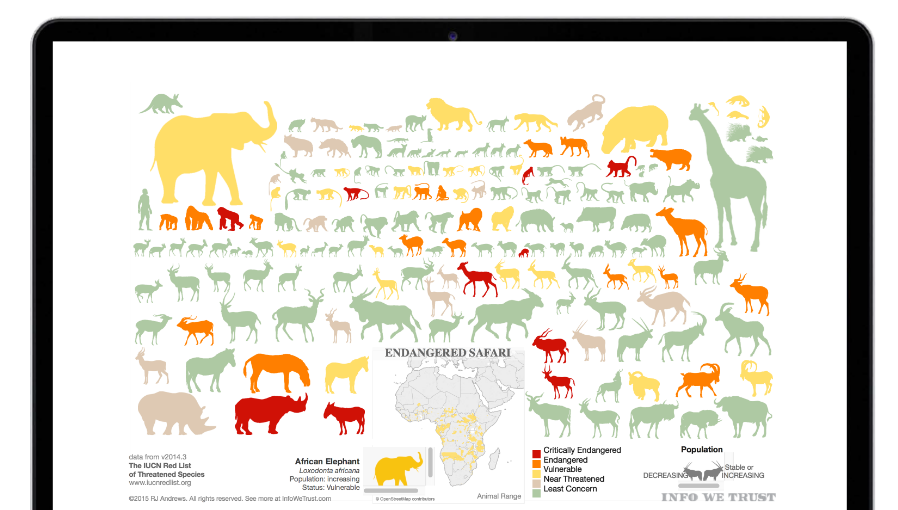
Stranding your data in isolated, static graphs limits the number and depth of questions you can answer. Take the first step and transform your data into effective visualizations (any kind of chart or graph) or dashboards. Let your analysis become your organization’s centerpiece by using it to fuel exploration!

Make your data better

This visualization shows the number of endangered species listed in Africa, but the animals themselves are lost in the story.

What different kind of visualization will tell the most truthful story, and best answer the questions at hand?


TRY TABLEAU FOR FREE

Full-version trial. No credit card required.

TRY TABLEAU FOR FREE

THE TRIAL CANNOT BE INSTALLED ON MOBILE DEVICES.

TEKNISKA SPECIFIKATIONER


OPERATIVSYSTEM
  • Windows 7 eller senare
  • OSX 10.10 eller senare

VIRTUELLA MILJÖER
  • VMWare | Citrix | Hyper-V | Paralleller
  • Tableaus produkter fungerar i virtuella miljöer när de konfigureras med rätt operativsystem och hårdvara.

INTERNATIONALISERING
  • Våra produkter är Unicode-aktiverade och kompatibla med data på alla språk. Gränssnitt och dokumentation finns på engelska, franska, tyska, spanska, brasiliansk portugisiska, japanska, koreanska och förenklad kinesiska.

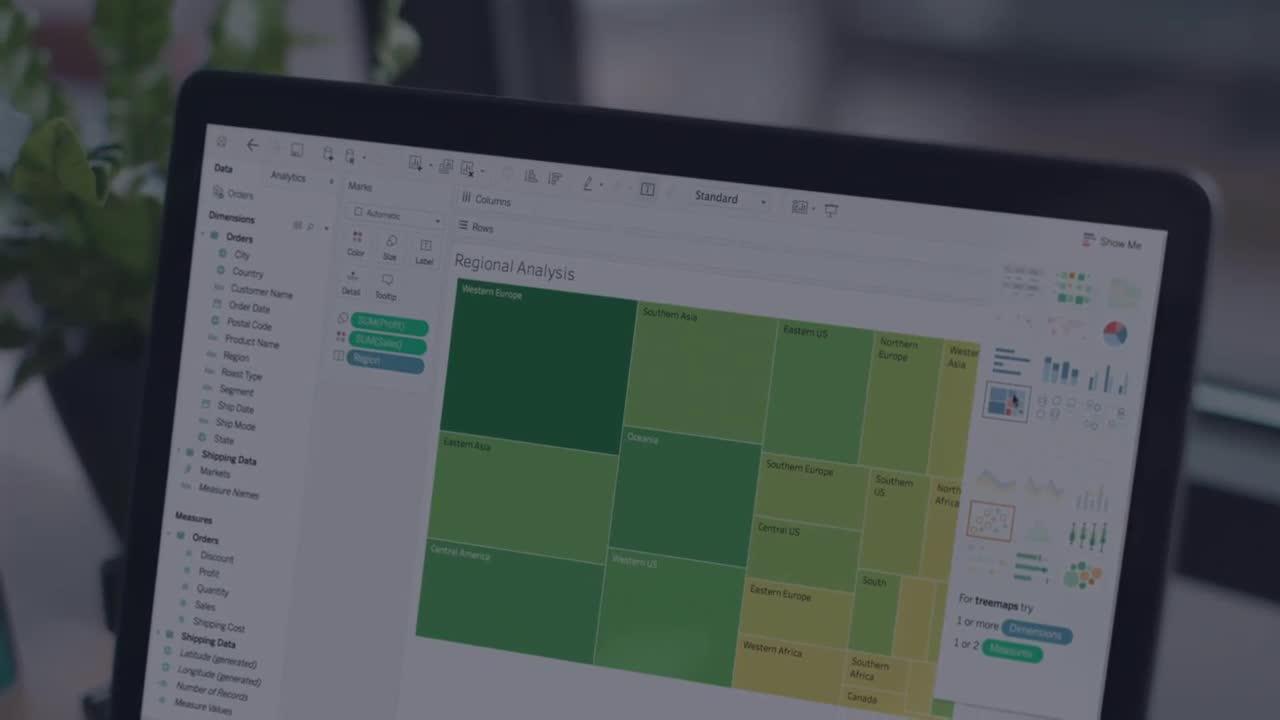
Explore your data with a purpose

Data visualization is a form of visual art that grabs our interest and keeps our eyes on the message. When we see a chart, we quickly see trends and outliers.

If we can see something, we internalize it quickly. If you’ve ever stared at a massive spreadsheet of data and couldn’t see a trend, you know how much more effective a visualization can be.

Try Tableau for Free

Before it was always numbers in rows and columns. Now I’m eager to see when I do a new analysis, because it's so much easier to actually see the trends, the story, and the power the data brings.
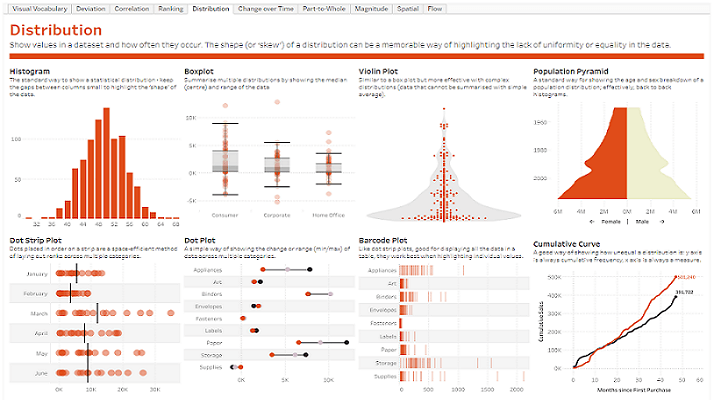
Om Tableau

Tableau hjälper människor att omvandla data till insikter som kan leda till handling. Visuella analyser utan begränsningar låter dig utforska fritt. Skapa dashboards och utför ad hoc-analyser med bara några klick. Dela ditt arbete med vem du vill och påverka din verksamhet. Allt från globala koncerner till startups och småföretagare över hela världen använder Tableau för att se och förstå sin data.


Omnämnt i

Fortune
Fast Company
Wallstreet Journal
Wired

Get Your Free Trial

Fyll i formuläret för att starta din kostnadsfria provperiod. Vårt team kommer att kontakta dig för att du ska få ut så mycket som möjligt av din provperiod.

Har du redan ett konto? Logga in här
Adress