Create Professional Graphs

Try Tableau for Free

Full-version trial. No credit card required.

See for yourself how speed, scale, and innovation come standard with Tableau.

Fast Analytics

Connect and visualize your data in minutes. Tableau is 10 to 100x faster than existing solutions.

Ease of Use

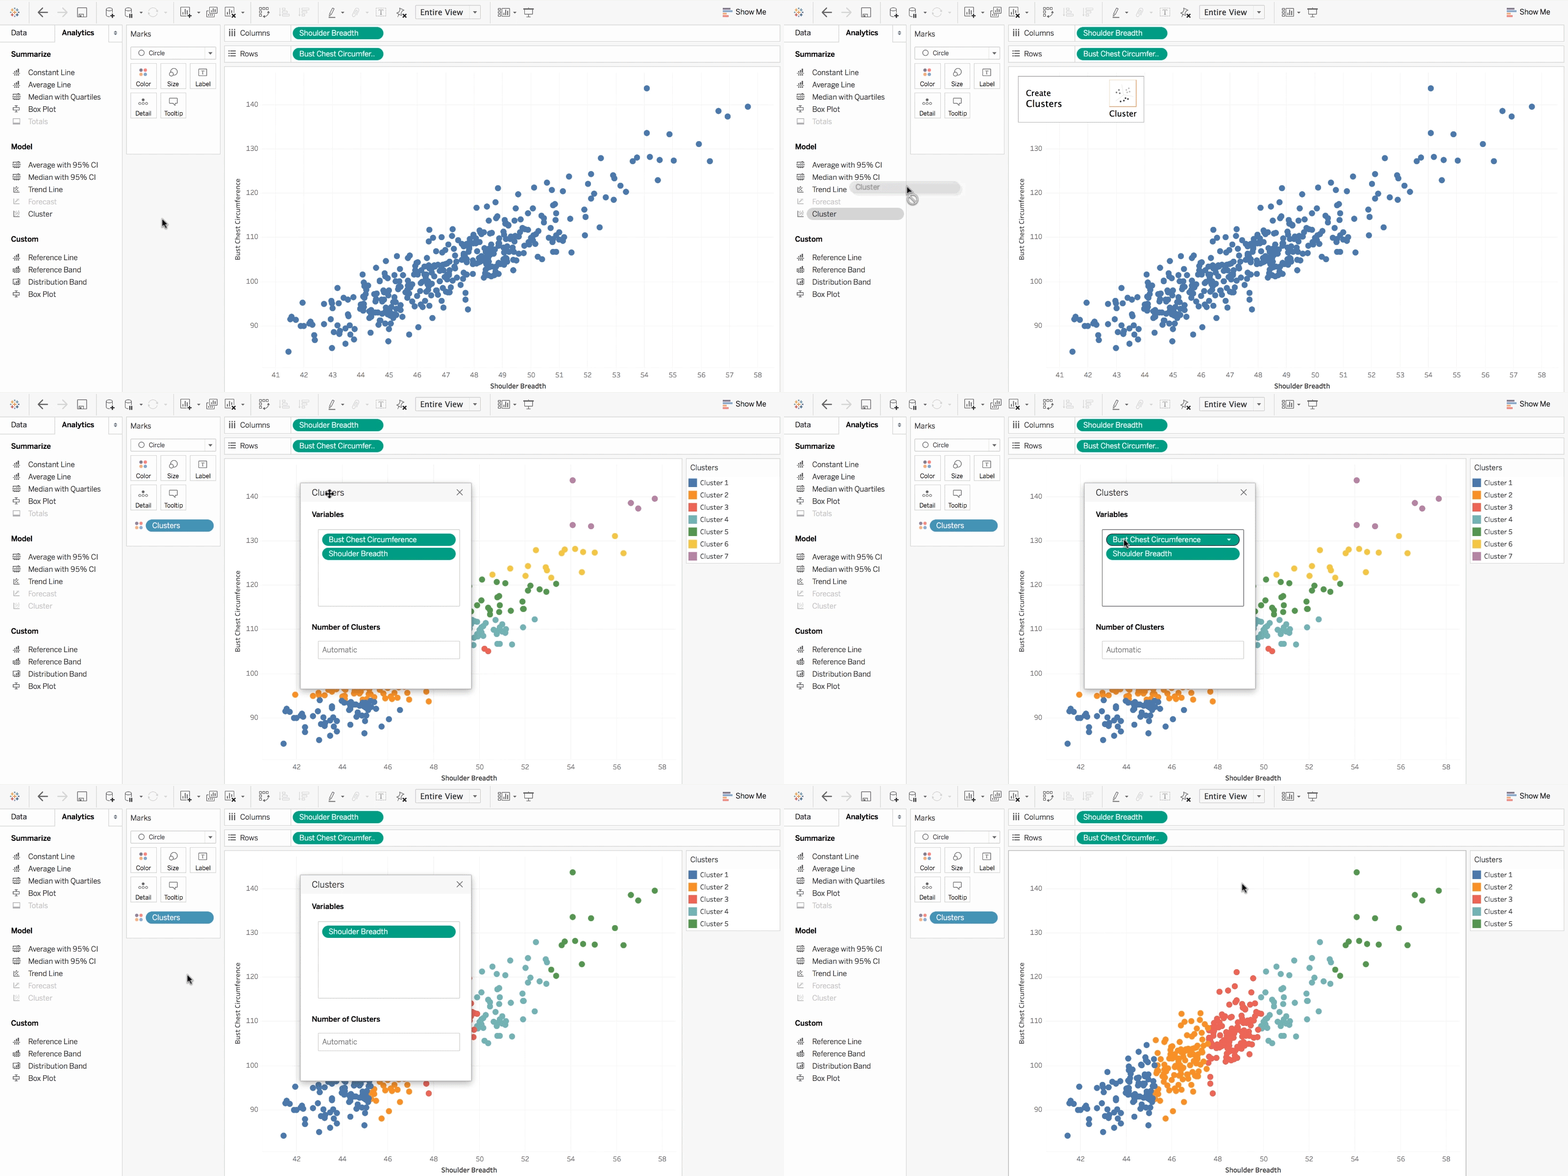
Anyone can analyze data with intuitive drag & drop products. No programming, just insight.

Big Data, Any Data

From spreadsheets to databases to Hadoop to cloud services, explore any data.

Smart Dashboards

Combine multiple views of data to get richer insight. Best practices of data visualization are baked right in.

Update Automatically

Get the freshest data with a live connection to your data or get automatic updates on a schedule you define.

Share in Seconds

Publish a dashboard with a few clicks to share it live on the web and on mobile devices.

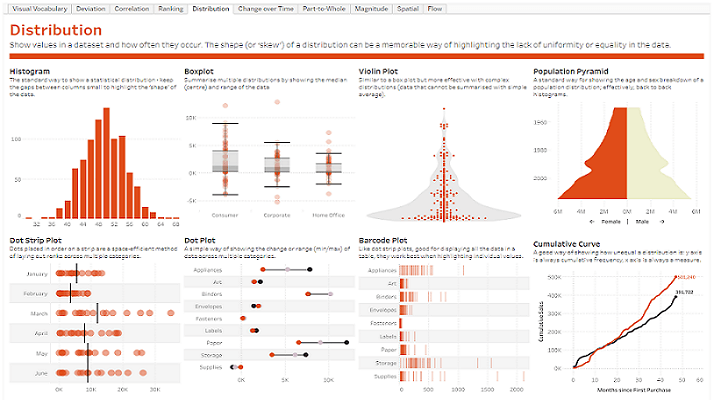
You have data and you have questions about that data. You know that there is a chart or graph out there that will help answer your questions, but it is not always easy to know which chart or graph is best without some trial and error.

Stranding your data in isolated, static graphs limits the number and depth of questions you can answer. Take the first step and transform your data into effective visualizations (any kind of chart or graph) or dashboards. Let your analysis become your organization’s centerpiece by using it to fuel exploration!

Make your data better

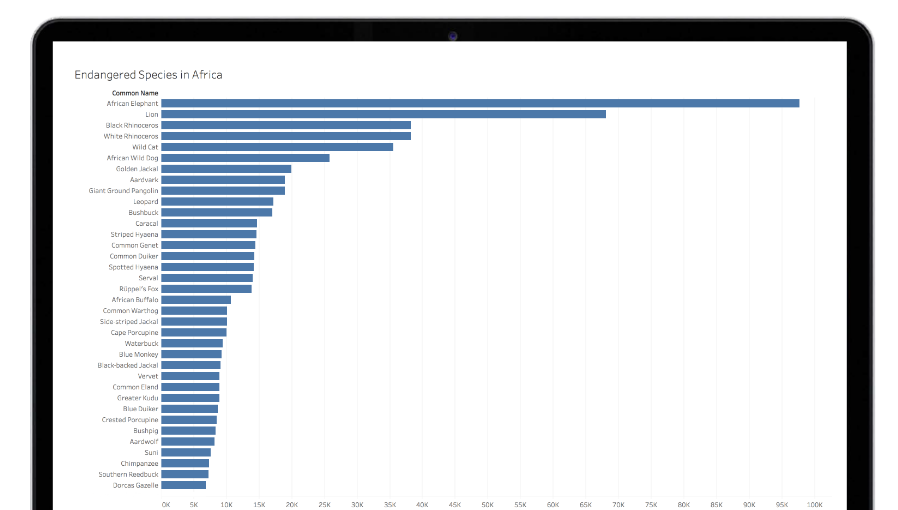
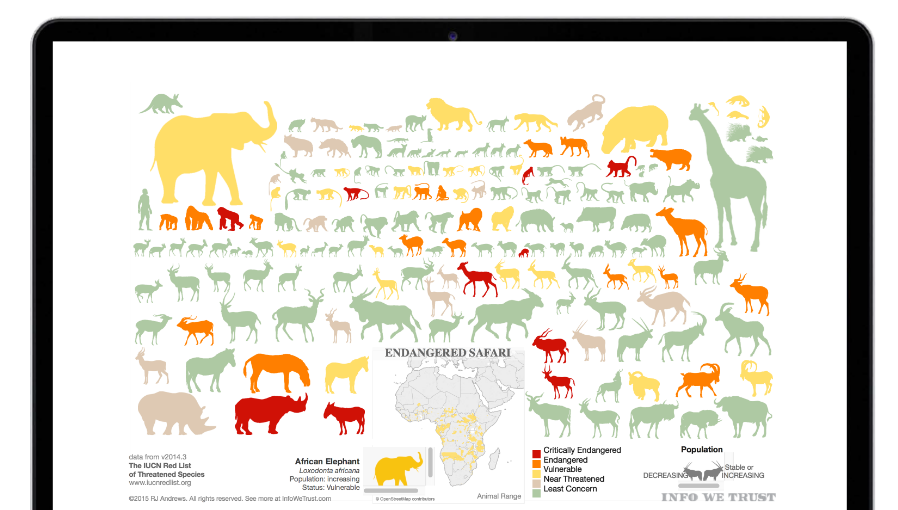
This visualization shows the number of endangered species listed in Africa, but the animals themselves are lost in the story.

What different kind of visualization will tell the most truthful story, and best answer the questions at hand?


TRY TABLEAU FOR FREE

Full-version trial. No credit card required.

TRY TABLEAU FOR FREE

THE TRIAL CANNOT BE INSTALLED ON MOBILE DEVICES.
Technische specificaties weergeven


Besturingssystemen
  • Windows 7 of nieuwer
  • OSX 10.10 of nieuwer

Virtuele omgevingen
  • VMWare | Citrix | Hyper-V | Parallels
  • Producten van Tableaus werken in gevirtualiseerde omgevingen, mits ze zijn geconfigureerd met het juiste onderliggende besturingssysteem en de juiste hardware.

Internationalisering
  • Onze producten werken met Unicode en zijn compatibel met data die in welke taal dan ook zijn opgeslagen. De interface en documentatie zijn beschikbaar in het Engels, Frans, Duits, Spaans, Braziliaans-Portugees, Japans, Koreaans en vereenvoudigd Chinees.

Explore your data with a purpose

Data visualization is a form of visual art that grabs our interest and keeps our eyes on the message. When we see a chart, we quickly see trends and outliers.

If we can see something, we internalize it quickly. If you’ve ever stared at a massive spreadsheet of data and couldn’t see a trend, you know how much more effective a visualization can be.

Try Tableau for Free

Before it was always numbers in rows and columns. Now I’m eager to see when I do a new analysis, because it's so much easier to actually see the trends, the story, and the power the data brings.
Over Tableau

Tableau helpt mensen data om te zetten in praktische inzichten. Verken de data aan de hand van onbeperkte visuele analyses. Bouw dashboards en voer ad-hocanalyses uit met enkele muisklikken. Deel je werk met iedereen en zet iets neer binnen je bedrijf. Van internationale ondernemingen en beginnende start-ups tot het MKB: overal wordt Tableau gebruikt om data te kunnen zien en begrijpen.


Uitgelicht in

Fortune
Fast Company
Wallstreet Journal
Wired

Get Your Free Trial

Vul het formulier in om met je gratis proefperiode te beginnen. Ons team neemt contact met je op met advies, zodat je de proefperiode optimaal kunt benutten.

Heb je al een account? Meld je dan hier aan
Adres