Make better decisions based on case data
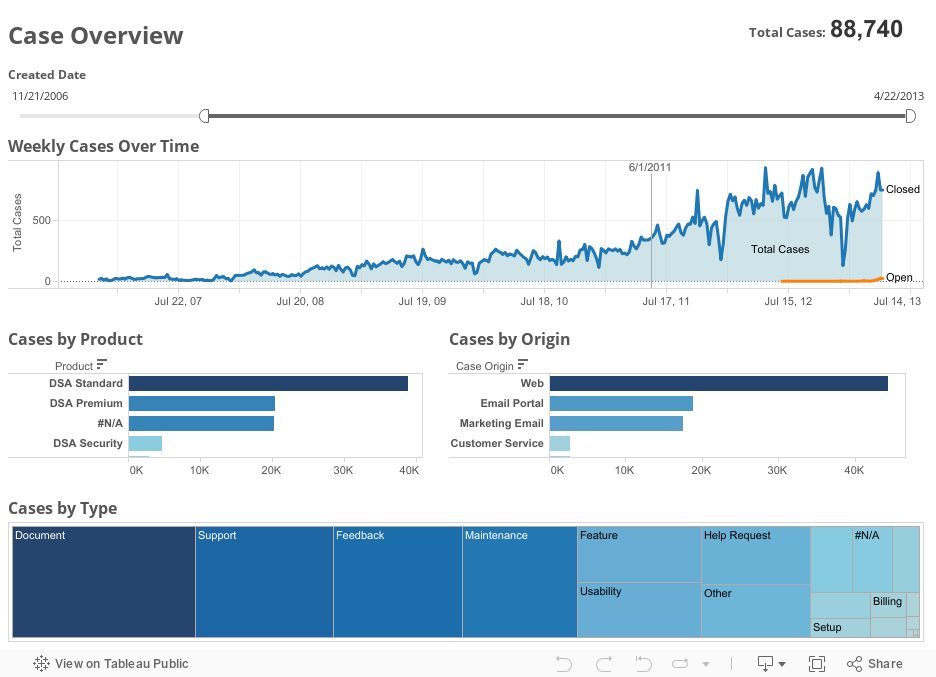
An executive overview provides a high-level look at case activity within the department. The top chart allows you to keep an eye on your total case volume and its changes over time. The bottom three charts let you see case by product, origin and type.
This overview data is crucial for managers. For example during budget squeezes, this dashboard could be used to defend headcount on your team. In this example, your weekly case volume has been rising dramatically in the past three years except for a couple of temporary dips. Cutting jobs in your department will likely cause longer waiting periods for customers and a much heavier workload for current employees.
For companies proactive about improving products and services, case data organized by product, type and origin offers an excellent place to start. Look at products and types that pop up in support cases most often to identify areas ripe for improvement. Case origin information can also help you communicate more effectively with your customers by understanding which contact channels customers use most.