5 ways to conquer tomorrow’s revenue models with modern pricing analytics


Companies are selling their products in more creative ways than ever before. On-demand ridesharing has transformed transportation. Subscription music and video streaming services are now ubiquitous and digital payment technology is accepted at online retailers, farmers markets, and everywhere in between.
At Tableau, we have seen this change firsthand as the software industry rapidly shifts from one-time, perpetual license sales to new subscription offerings. However fast your business model transition may be, one of the biggest challenges can be managing your business in the middle of change. When you have customers purchasing under both old and new sales models, you need to dive into deeper, segmented analysis to identify insights and make data-driven business decisions along the transition journey.
Additionally, revenue recognition rules have completely changed just as many business models are changing. The shifts in business models and accounting rules present a huge need for CFOs to communicate results to investors in a way that confidently articulates changes. Amidst all of this change, executives expect their finance teams to advance beyond traditional reporting and analysis and provide trusted advice and strategies to move their businesses forward. Many finance leaders recognize this need, but struggle to identify best practices in elevating their analysis.
Best practices to manage changing business models
Here are five best practices that Tableau’s finance team learned during our own business transition. We will show how you can use our platform to navigate the added complexity today’s businesses face.
1. Align your business on metrics that matter.
Metrics that measured your old business model’s performance are often less relevant to new, go-forward strategies. Take the time to align your leadership team on new key metrics and, more importantly, on common definitions for those key metrics. Metrics like Annual Recurring Revenue (ARR) sound simple in theory, but agreeing on precise calculations and storing them as custom fields in accessible, published data sources can prevent two teams from reporting different results on the same metric.
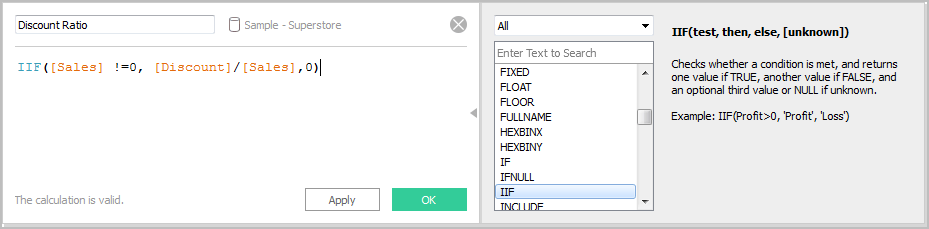
In Tableau, custom fields like the discount ratio above are easy to create. Sharing fields like this one through a certified data source enables teams to align on common metrics and avoid reporting on the same data differently.
2. Monitor customer cohorts carefully.
As your business model transition occurs, it is helpful to measure where groups of customers are along the journey with you. Cohort analyses using Tableau features like Level of Detail (LOD) expressions can help you answer questions like the ones below:
- Are customers acquired under new business models spending more or less money than those acquired under my traditional business model?
- Are segments of different business sizes, geographies, and industries reacting to my new pricing differently?
- How are market baskets, product bundles, and purchase frequencies changing?
When you are able to surface insights from the right level of detail, your finance team can proactively advise your business on whether regional go-to-market strategies are effective in selling under your new business model or whether certain customer groups could use further support along your journey.
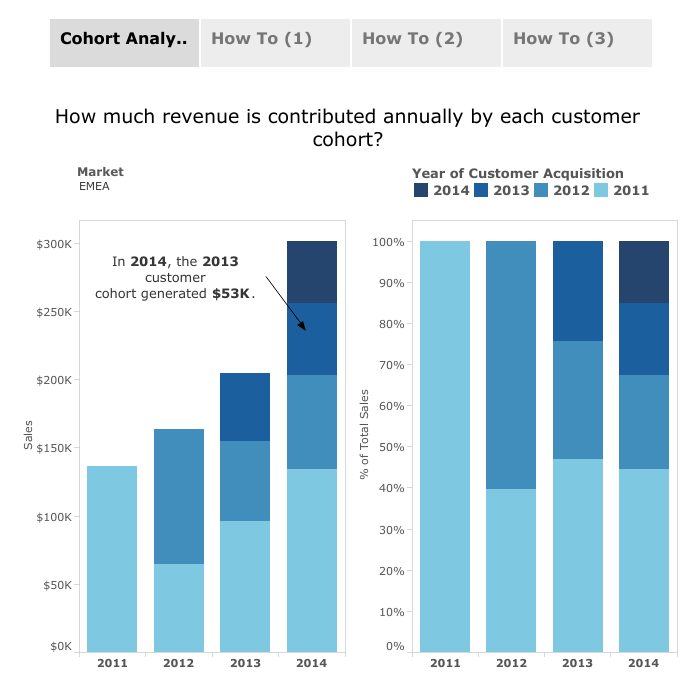
Learn more about how to build a cohort analysis like this one in our Level of Detail (LOD) expressions blog post.
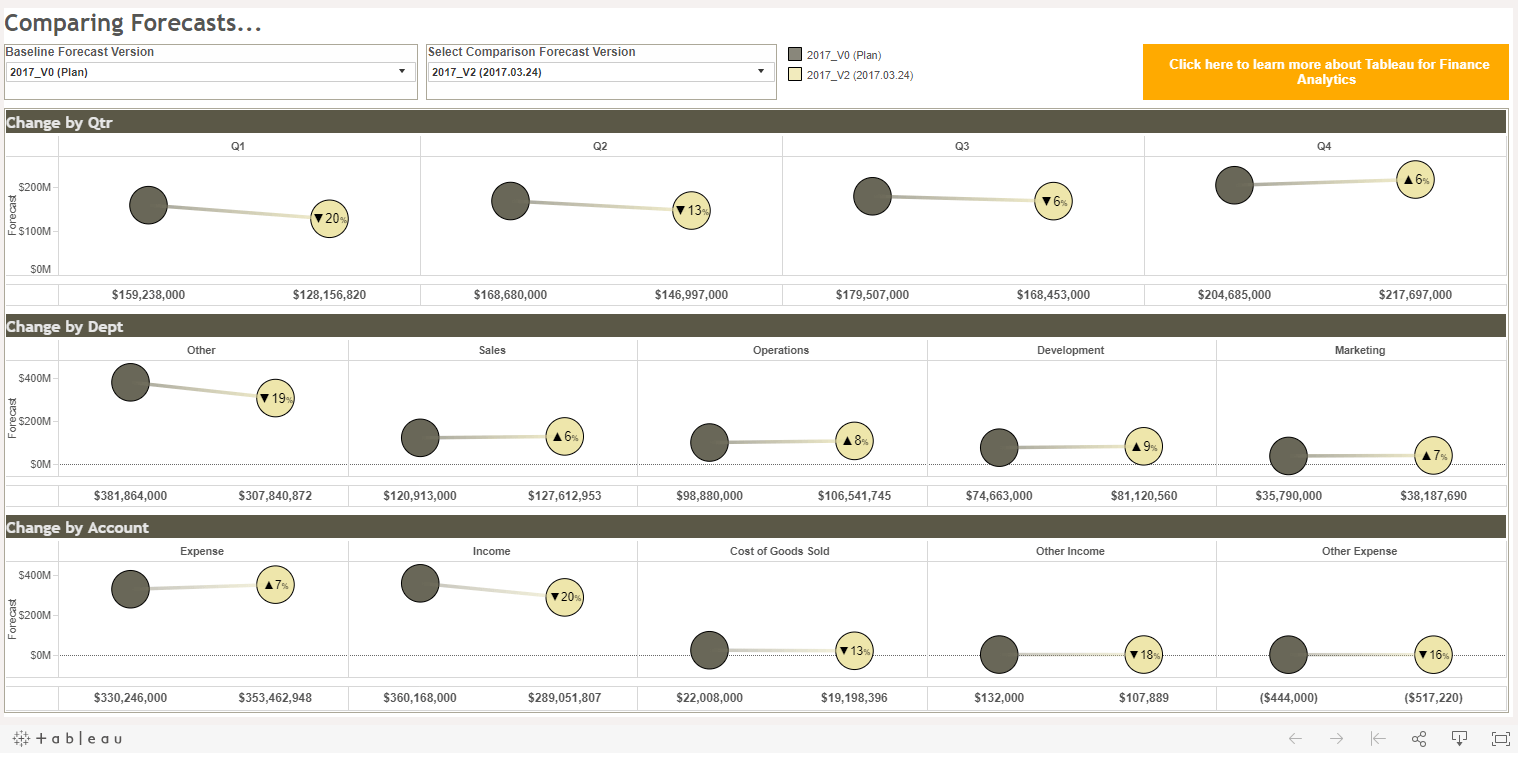
3. Prepare for continuous forecasting.
When business models change, pricing, product bundling, and channel-specific strategies are likely to change as well. Running numerous forecasting scenarios under different assumptions can become dizzying to track. At Tableau, our FP&A team uses dashboards that allow us to compare iterative forecasts with ease. This allows us to take complicated, driver-based forecasts and express the various forecasting outcomes in a simple way.
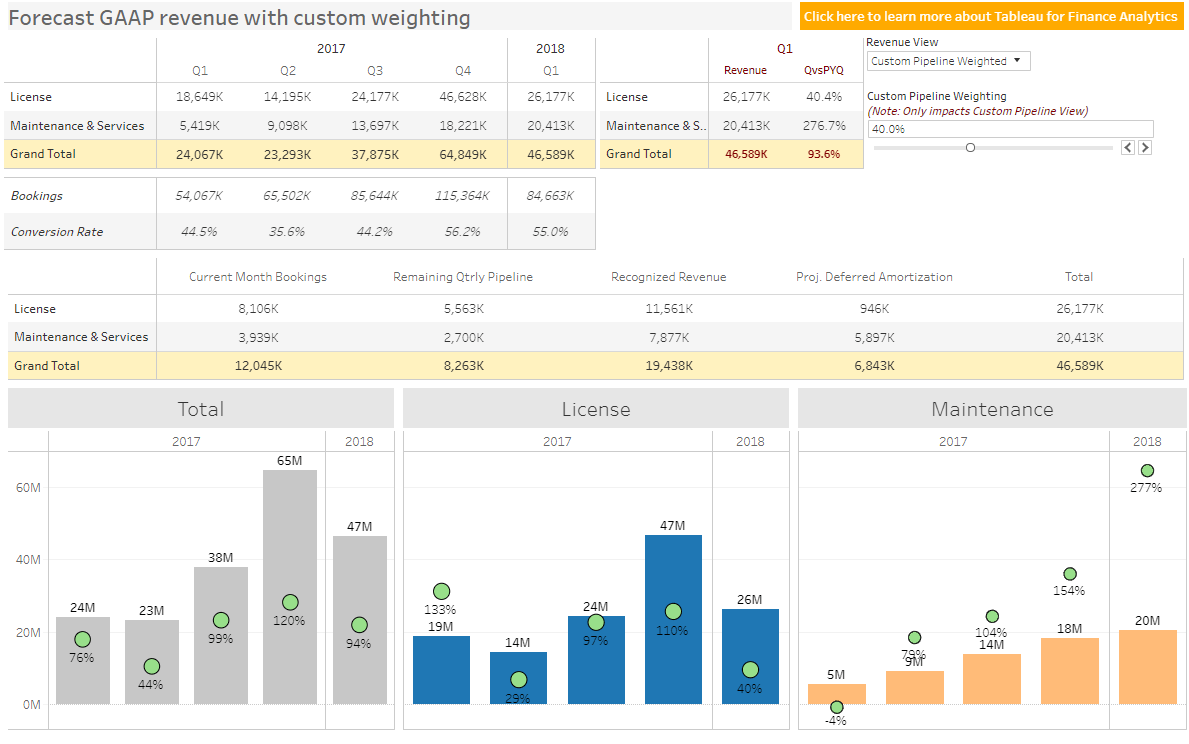
4. Bridge your GAAP.
One-time sales and subscription models can have very different revenue recognition patterns under generally accepted accounting principles (GAAP). The transition to ASC 606 revenue rules has also been its own journey for the broader finance community. At Tableau, we use dashboards like this one that forecast revenue on a GAAP basis. When you have a strong forward look on your revenue, your finance team can proactively work to bridge how business model and accounting standards changes have affected your results compared to historical periods. GAAP revenue forecasting provides the lead time needed to evaluate how you will communicate your results rather than reactively rushing through analyzing results after your accounting close process.
5. Dive into pricing analysis.
Pricing is one of the most delicate parts of a business model transition. Setting prices that convey the value you are delivering and establishing discounting strategies to remain competitive are common across B2B and B2C businesses in many industries.
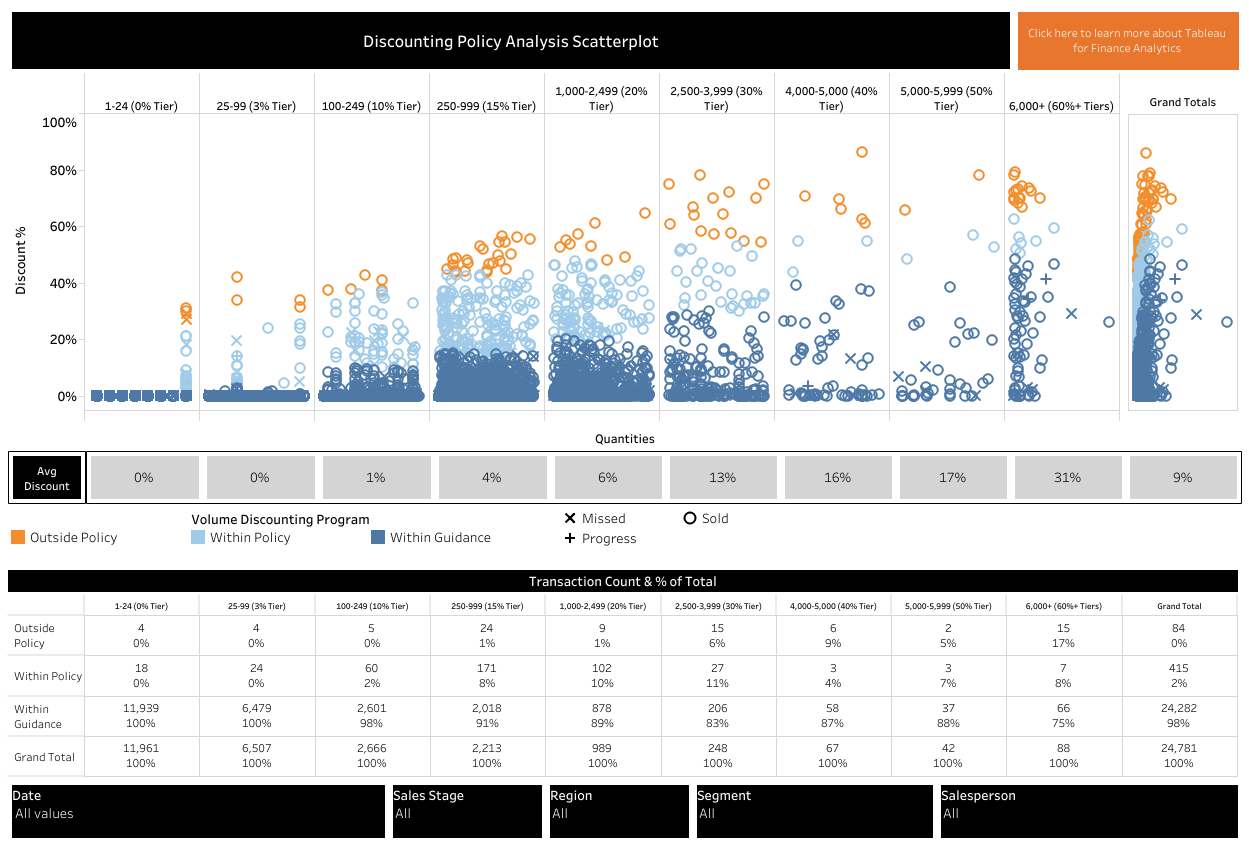
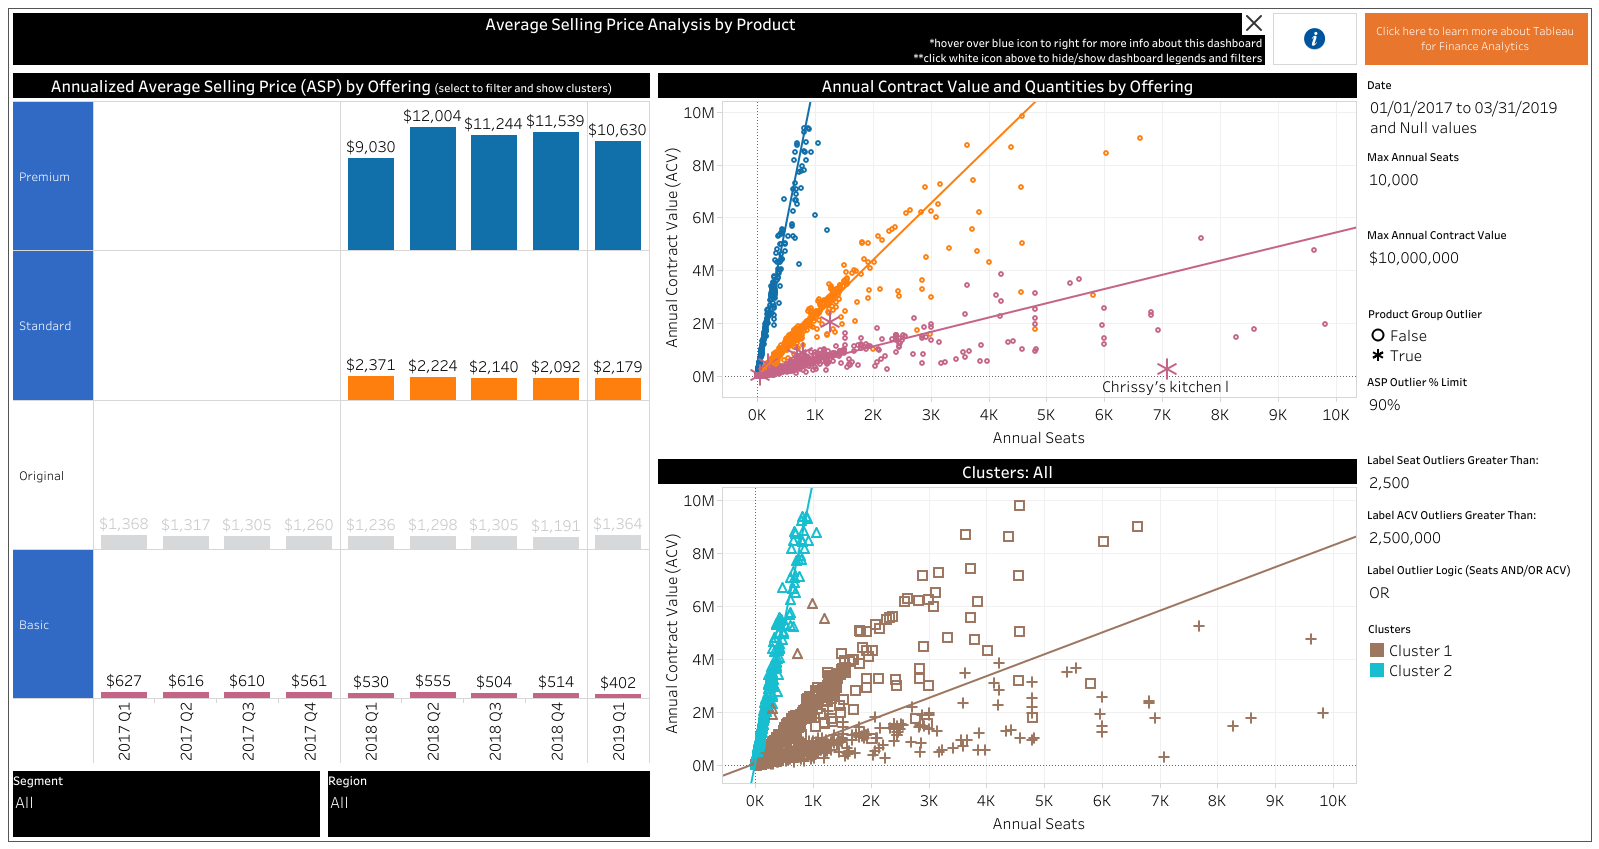
Once you have set your price levels and discounting policies, it can be all too easy to make deal-by-deal pricing decisions without seeing the impact to aggregate trends. Scatterplot dashboards like the ones below can help you spot outliers and pricing trends in your sales data.
- Discounting Policy Analysis Scatterplot: Identify outliers and trends in your company’s use of discounts relative to its policies.
- Average Selling Price (ASP) Dashboard: Analyze your average selling prices by product and by order size to identify outliers and trends.
The finance departments of the future must be proactive rather than reactive. That means supporting and advising on strategic shifts, not just reporting on what has already happened. We hope that by learning from some of the best practices we have learned, you will find your finance department acting as a trusted business advisor in business transformations to come.
To learn more about the Tableau approach to pricing analytics, watch the "Driving proactive pricing analytics for FP&A" webinar. Members of the Tableau finance organization discuss the thinking that went into the dashboard design and share insights into how you can make it actionable for your team.
Relaterade berättelser
How EMD Serono is improving patient care with personalized, AI-powered insights from Tableau
 30 September, 2024

Embedded Analytics: Should you build or buy?
 7 Juni, 2022

Data fabric’s value to the enterprise
 11 Maj, 2022