How to Create an Interactive Resume in Tableau


Note: This piece is part of Back-to-School Month here on Tableau Public.
So you’ve decided to put your resume out into the world. It’s a big step, and before you take it, you have to make sure that your background and talents shine bright.
It sounds easier than it looks, what with people creating increasingly innovative and interesting resumes. But with Tableau, you can make something else entirely—not just a visual resume but an interactive resume.
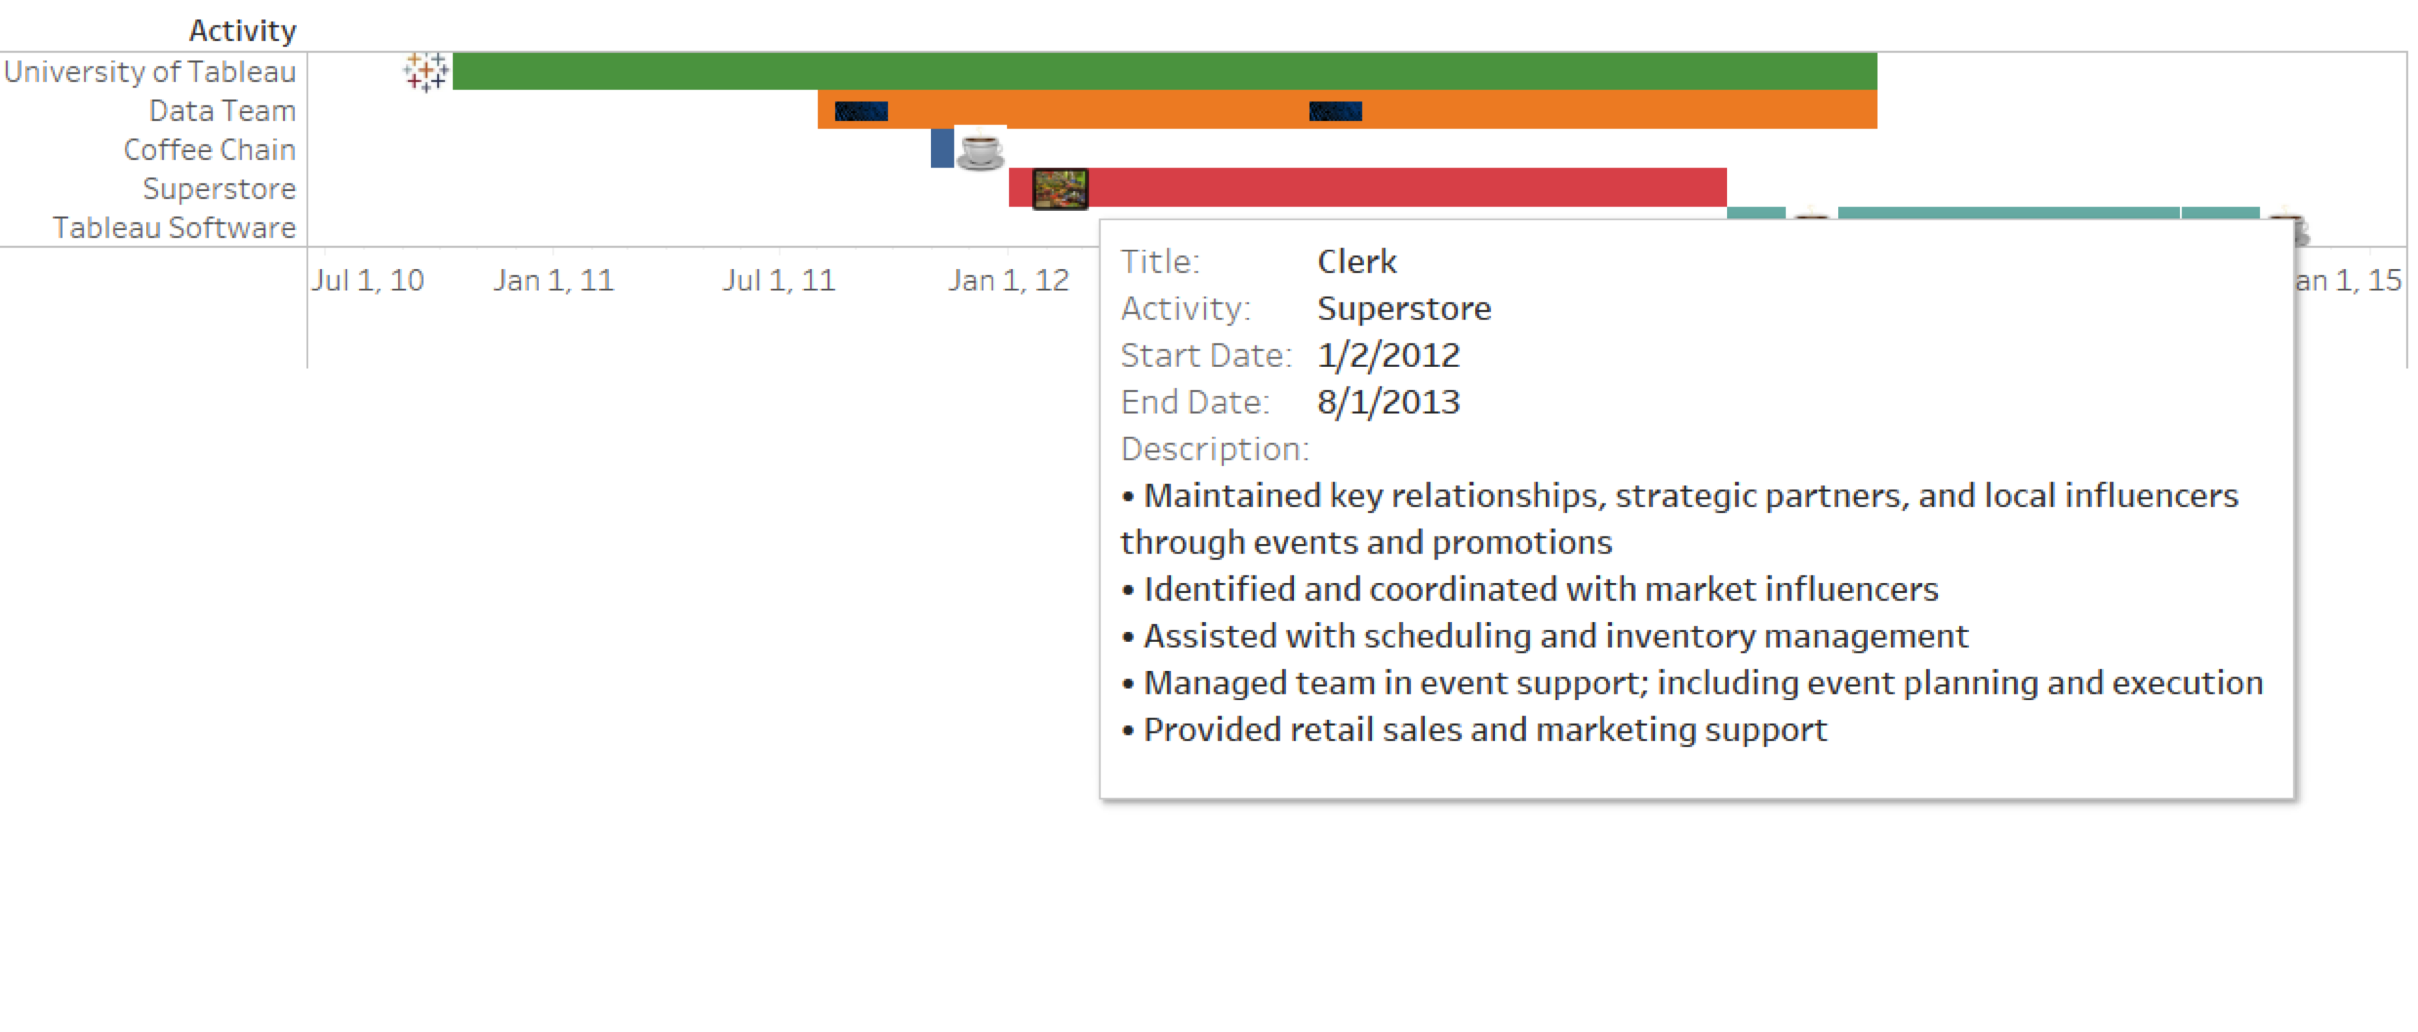
So what does an interactive resume look like? Here’s mine as an example. Hover over each icon to see the details.

Ready to build your own? Here are five tips to help you get started.
1. Prep Your Data for Success
Before you start building your resume, map out what you want to include in your resume. At the very least, you'll want to include the basic elements of your text resume. These include job title, extracurricular activities, who you worked for and when, and a smattering of skills and expertise. Then convert that information into a tabular form that's readable with Tableau. Remember, you can use Google Sheets now, too.
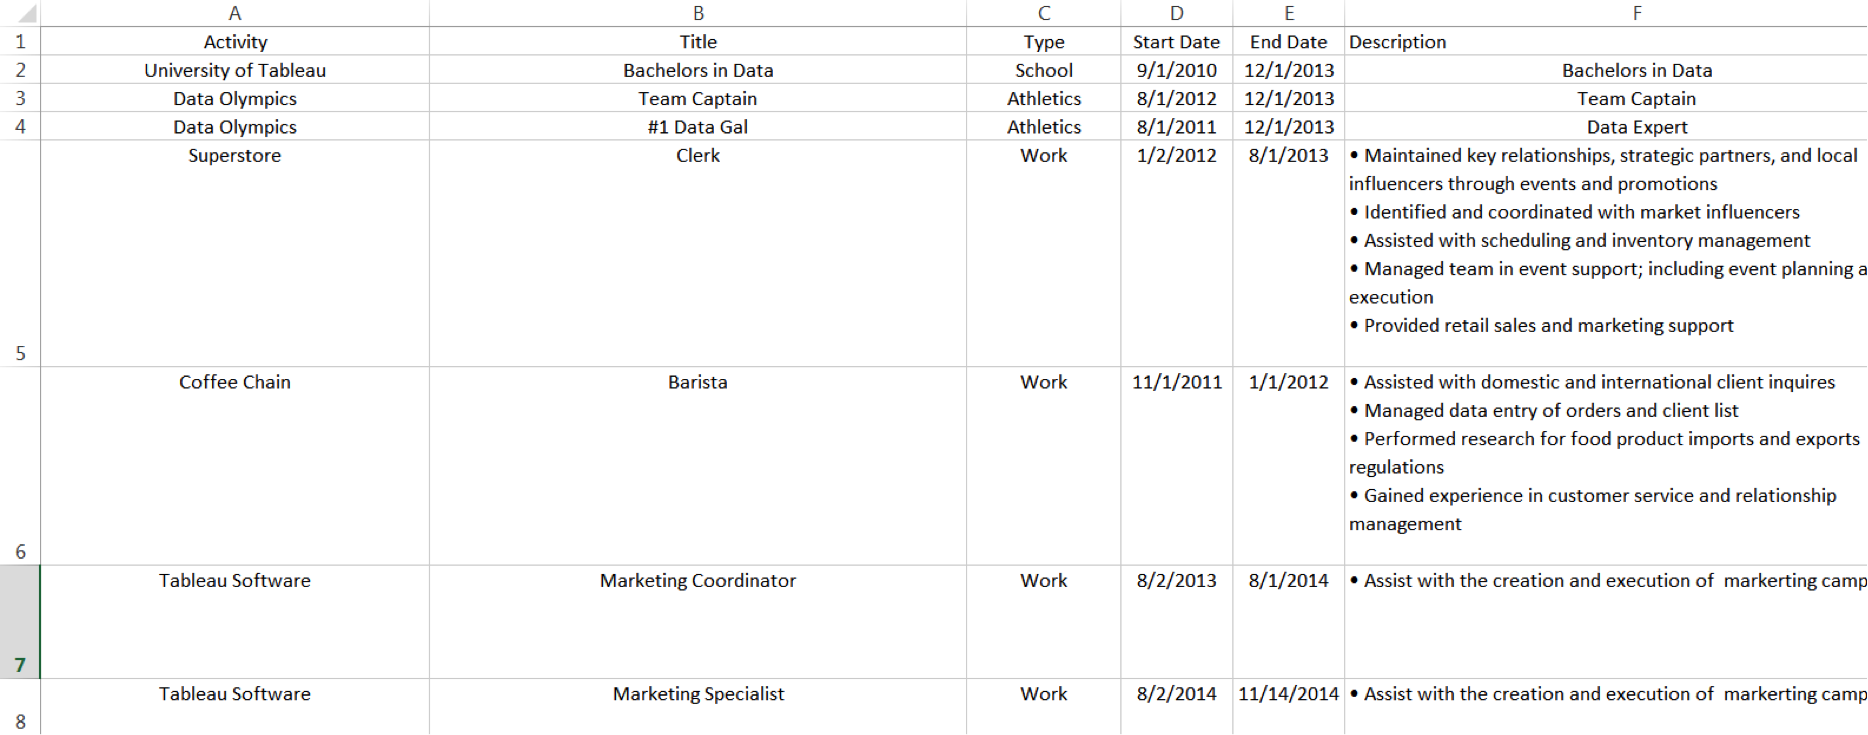
Each activity and extracurricular should have its own row. If you have different titles within the same company, university, or extracurricular, continue to add a new row for each item. Include columns for start and end dates for each job and activity. Don't forget to add a column for your job description.
2. Build a Gantt Chart
Now that you have your resume data set up for success, it's time to build your resume. While there are many ways to visualize time series data, Gantt charts are an easy way to show job duration by displaying activity in incremental time periods. They also provide greater context to your activities—showing relationships between concurrent jobs and extracurricular, career progression at different companies, and job duration.
The most important step here is the datediff calculation. All it does is calculate the amount of time between your start date and end date, denominated by year, month, day, etc. It’s crucial because without it, all you’ll end up with is a flat line.
3. Custom Shapes FTW
Custom shapes can help you easily delineate your different roles in a single organization and add some personalization to your resume.
Importing custom shapes is simple. Navigate to your Tableau Repository folder. You'll find this in your documents folder. Select the Shapes folder, add a new folder, and save the images you need there. Select the mark type for your worksheet as shape, then drag your field onto the Shape area of the Marks card. (Learn more about custom shapes here.)
4. Condense Additional Details into a Single Tooltip
Your resume contains lots of valuable information about your experience, but too much text often takes away from the impact of a simple, skimmable visual resume. Tooltips are a great way to include important details without sacrificing design.
Add your lengthy job description and bullet points in a tooltip. That way, when your future employer wants to learn more, it's as easy as hovering over your custom images or Gantt chart. Drag and drop 'Description' from the Dimensions pane onto Tooltip in the Marks Card. For bullet points in the tooltip, make sure your bullet points are listed in your spreadsheet the same way you want them to appear in the tooltip. You can see I have a bulleted list in each cell of the 'Description' column where I want a bulleted list to appear in the tooltip.
5. Link to Profiles
All your valuable information won't fit on single dashboard, so link to your external profile to provide the necessary context. With URL actions, it's easy to link to your public profile, LinkedIn resume, or any external website or portfolio you may have.
To make this work, we will need to add a data source that includes your external profiles and links to them. In this example, we will be using LinkedIn and Twitter. Here is what my spreadsheet looks like.

In the video below, you can follow along as I add this data to our workbook and use URL actions to create clickable links. (If you are curious about how else URL actions can be used, you can learn more here.)
After you’re done, it’s time to admire your creation and post it to Tableau Public so you can share it on your LinkedIn and your paper or digital CV. If you want to learn more about building interactive resumes with Tableau, check out this free recorded webinar. Happy vizzing!
What do you wish you knew when you were just starting your data journey? Share your tips and advice with us in the comments below, or via Twitter and Facebook using the hashtag #datalessons.
Relaterade berättelser

Iron Viz 2026: Read Between the Data
 28 Maj, 2026

Tableau's Iron Viz Winners

Explore the 2026 Iron Viz Entries
 15 December, 2025