How to build advanced analytics applications with TabPy
Learn about TabPy, which makes it possible to use Python scripts in Tableau calculated fields. When you pair Python’s machine-learning capabilities with the power of Tableau, you can rapidly develop advanced-analytics applications that can aid in various business tasks.


TabPy makes it possible to use Python scripts in Tableau calculated fields. When you pair Python’s machine-learning capabilities with the power of Tableau, you can rapidly develop advanced-analytics applications that can aid in various business tasks.
Let me show you what I mean with an example. Let’s say I’m trying to identify criminal hotspots in Seattle, my hometown. I’ll use data from the Seattle Police Department showing 911 calls for various type of criminal activities in the past few years. With this data, it is really hard to visually identify patterns given the density of activity and noise in GPS readings.
Let’s see what we can find out by applying some unsupervised machine learning. Density-based spatial clustering of applications with noise (DBSCAN) is a well-suited algorithm for this job. It is also installed conveniently by default as part of TabPy. It takes two parameters: one to specify the maximum allowed distance between points for them to be considered part of the same cluster and one more to specify the minimum number of nearby points to constitute a cluster. 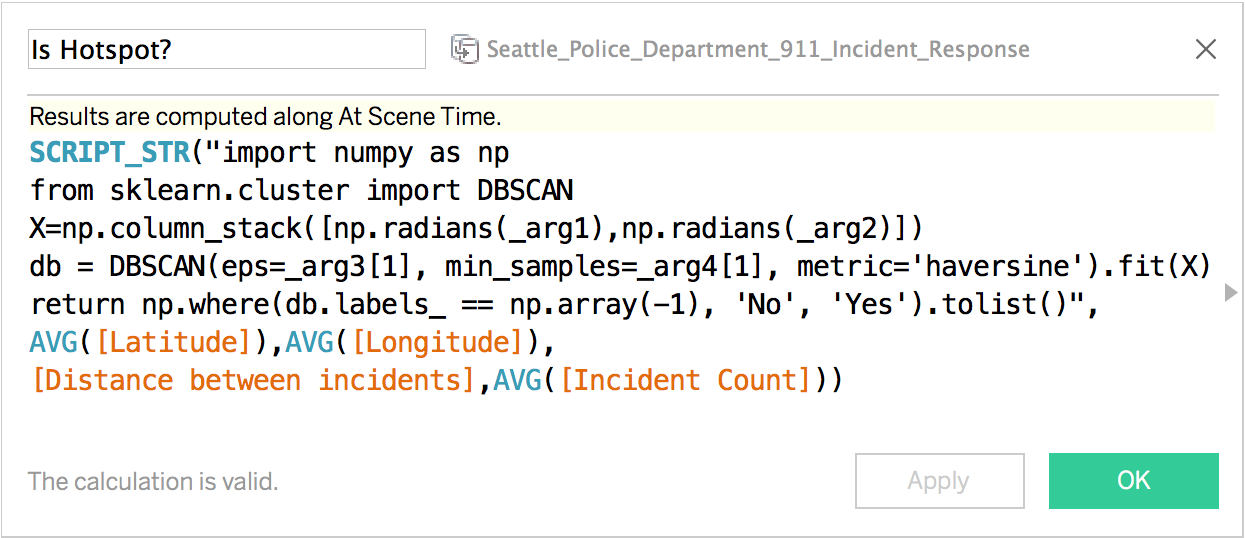 This allows for experimenting with different values of distance and event frequencies criteria. Different options can be more appropriate for downtown Seattle versus the suburbs, a police officer looking for hotspots versus a tourist looking for places to avoid, or a tenant looking for houses to rent or buy. You can download this example Tableau workbook here.
  Embedding the Python code into Tableau worked great in this example. But in some cases, you may want to host your Python scripts outside Tableau workbooks so they are centralized and easier to manage or because the models themselves require upfront training.
To demonstrate, let’s use a data set on breast cancer cases in Wisconsin. And let’s see if we can train a model that can provide the correct diagnosis given a patient’s test results. Let’s start with the model that is most easily accessible as part of our exploration: clustering, which we introduced in Tableau 10. When I simply double-click on clustering, I see that Tableau automatically finds two clusters corresponding to malignant and benign tumors, and identifies the cases with 92.2% accuracy. That’s pretty impressive considering I gave Tableau no hint whatsoever as to what the correct diagnosis were or even that there had to be two categories. But since we have this information in the data set, could we use a different algorithm that can learn from the actual diagnosis for these patients? Let’s try a variety of supervised machine-learning algorithms in Python and see how they will perform. You can download the Jupyter work containing all the Python code used for model training and evaluation here.
Before you can use it, you need to start Jupyter. 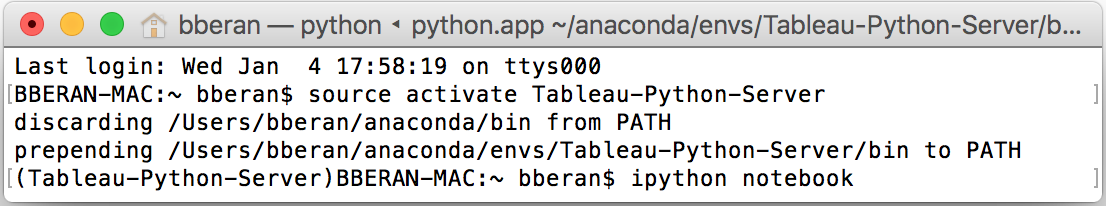 This will open Jupyter in your browser. If you downloaded the example notebook, you can navigate to the directory on this screen and click on BreastCancerExample.ipynb to open it.
 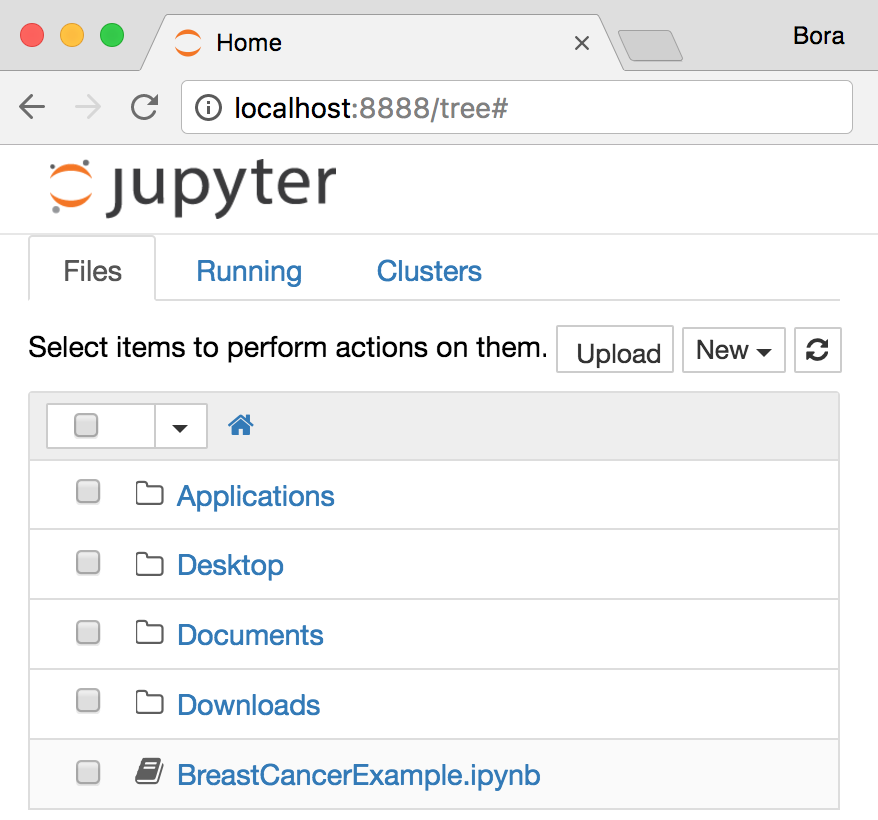 Once the notebook loads, your browser window should look like this. Note that this workbook relies on many packages in scikit-learn 16.0.1, the version which ships with TabPy by default. Earlier or newer versions may lack some of these methods or have different names for them.
 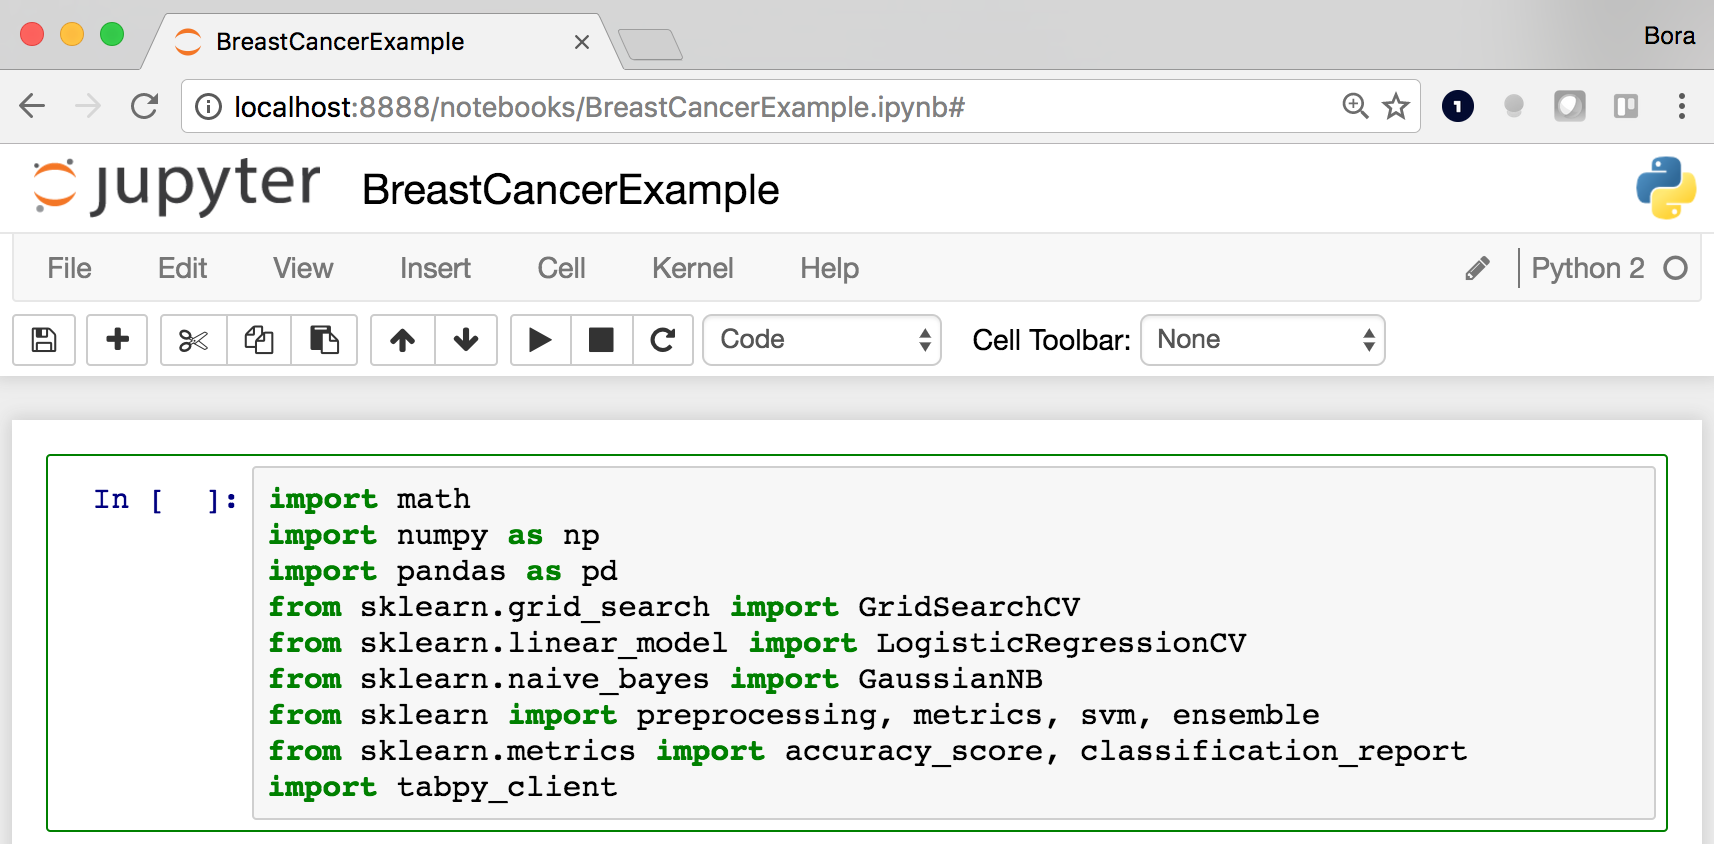 The notebook is extensively documented so I won’t get into the details in this post. (In a few words, what it does is to fit Naïve Bayes, Logistic Regression, Support Vector Machine and Gradient Boosted Tree models to the breast cancer data set by doing a grid search with k-fold cross-validation to find the best model.) This sample is also meant to be a template you can swap in different models easily, for example to use a neural network instead.
 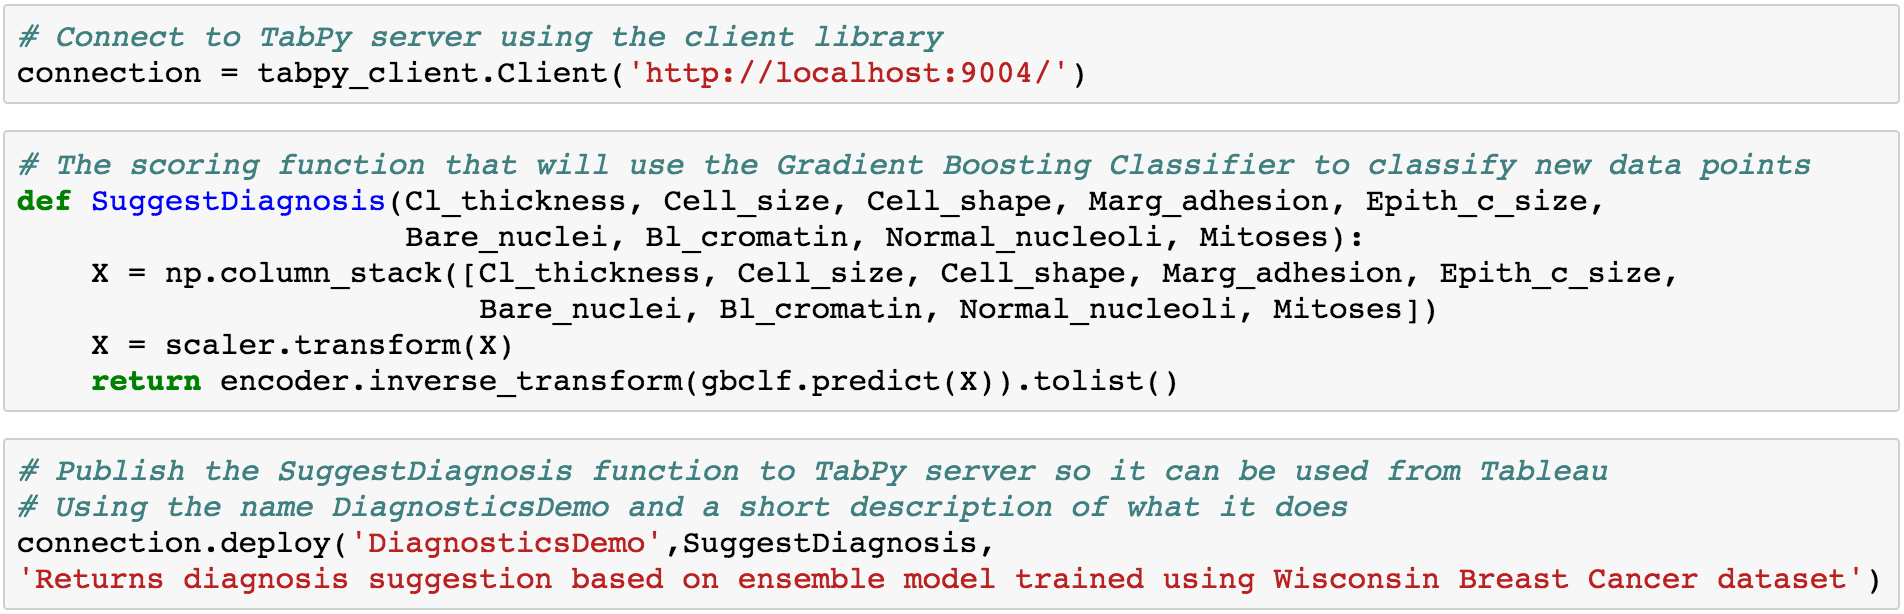 Then it deploys the best model (Gradient Boosting in this case) as a function to the TabPy server so it can be used to classify new data from Tableau dashboards.
 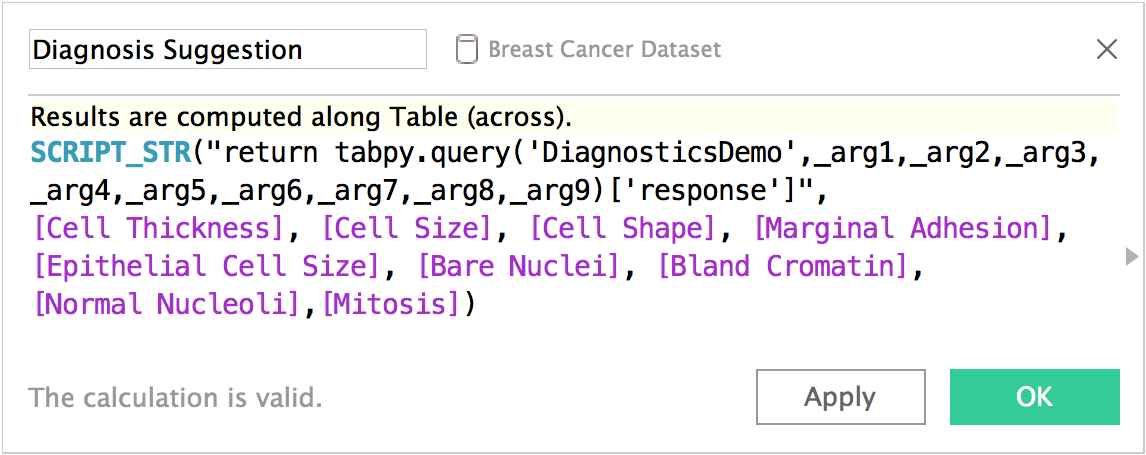 Now we can call the published function from Tableau with configurable parameters so one can enter values to get a prediction and embed it in a nice dashboard.
  You can download this example Tableau workbook here. There are many more use cases for TabPy for data scientists. You might use it to build models for your HR department to predict attrition. You might help your sales department score leads. Or you might be an ISV creating vertical-specific advanced-analytics applications using Tableau to help renters make more educated decisions when picking their next home.
Whatever your use case, TabPy can help take your analytics to 11. To learn more about TabPy and to install it, visit our GitHub page or visit this blog post. How are you using TabPy for advanced analytics? Tell us about your use case in the comments below.
Histórias relacionadas

Extend Access to Embedded Tableau Content with On-Demand Access
 22 Julho, 2026

The Tableau+ Bundle with Premium AI, Enterprise Capabilities, and Premier Success
 24 Junho, 2026

What is Tableau Prep?
 30 Abril, 2026