Subject Area: Architecture
Level of complexity: Advanced
Approximate Time to complete: 1 hour
Companion Workbook (twbx): ParametersVsActionsMultipleDataSources.twbx
Additional Resources on the web:
- http://kb.tableau.com/articles/knowledgebase/creating-filter-actions-dashboards
- http://kb.tableau.com/articles/knowledgebase/filter-data-sources
- http://kb.tableau.com/articles/howto/filter-multiple-data-sources-using-parameter
Customers often work with multiple data sets combined visually and interactively in dashboards. Using parameters and filter actions, a desktop user can design dashboards that can easily filter across multiple disparate data sources without using data blending. Both of these powerful approaches solve a traditionally complex problem – how to make multiple data sources seamlessly work together without combining them in a singular data model. There are a few reasons why a Tableau Desktop author might choose one approach over the other.
The Case for the Parameters Concept:
Parameters are very easy to create and can be leveraged by all data sources in a workbook. All parameters will be tied in one way or another in a calculated field in order to affect information on the view. One benefit to using parameters to filter across disparate data sources is the Desktop author can control the display options that are presented to the user. They might want to expose the selection as radio buttons, a drop down list, or potentially provide the end consumer with the ability to type in a value. These options can be very important because "screen real estate" is valuable when designing visually compelling dashboards. The parameter concept can also be very powerful because multiple parameters can be used in the filter calculation to affect the analyses.
This approach is not without some potential downsides. Two of the most significant challenges our customers face when using parameters are they are single select only, and they are not dynamic. As new members of the dimension are added to the data source, they will not be added to the list of parameters selections for filtering. This often requires maintenance by the dashboard creator to periodically update the available selections that are presented to the end consumer. If these two challenges are concerning to the dashboard author, they can use the filter action method as an alternative.
The Case for the Filter Actions concept
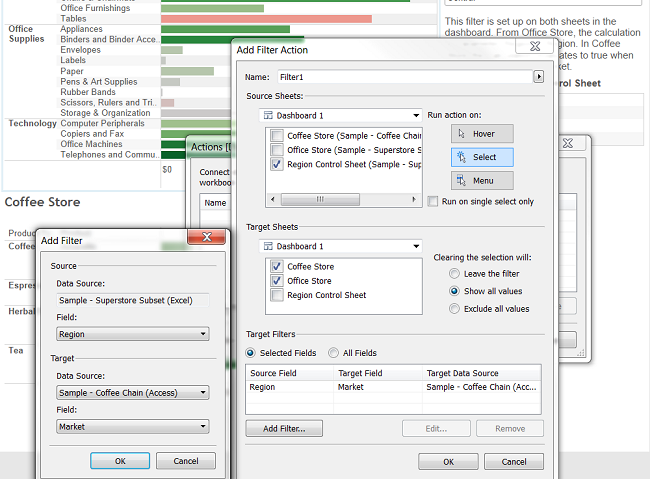
Filter actions use data from the primary data source as a "control" sheet that a user can click on to "drive" the other visuals on a dashboard. The knowledge base articles above explain the process of how to create these filter actions and use target filters on selected fields. These are useful to not only filter across data sources, but also specify the level of detail at which to apply the filter. One benefit over parameters is the ability to multi-select. Simply hold down control and click multiple items to run the action on. The list of dimension members that are displayed will be dynamically populated. The one major downside to this method is if the list of members is long it may be slow to populate and render and it reduces the available space on the dashboard. The following screen shot shows how to set the target filters so the region field filters both on Region and Market.
The companion workbook has an example of both methods for your learning pleasure.