Visualize historic data to estimate cost impact
Using historic data to estimate future premiums isn’t new. But creating an interactive report that facilitates quick insight to forecast these costs is not a common feature in most insurance reporting tools.
Don’t limit yourself to a slide deck that only shows top-line estimates or spend time wading through dozens of spreadsheet tabs looking for answers. By using Tableau to create an interactive report that’s right for your needs, you can quickly be evaluating your options and future costs, not waiting for a new round of analysis.
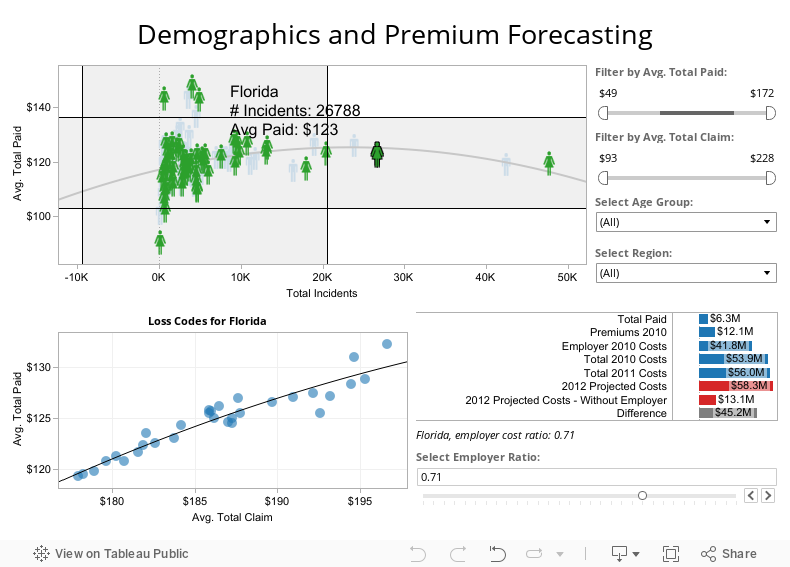
This sample report makes it intuitive to ask – and answer – real-time questions about how projected costs for an employer could vary based on several factors. Gender, age, region all affect estimated costs. Click on the visualization to adjust these criteria and others to see historic trends and projected costs.