Blend survey data to learn how your customers really feel
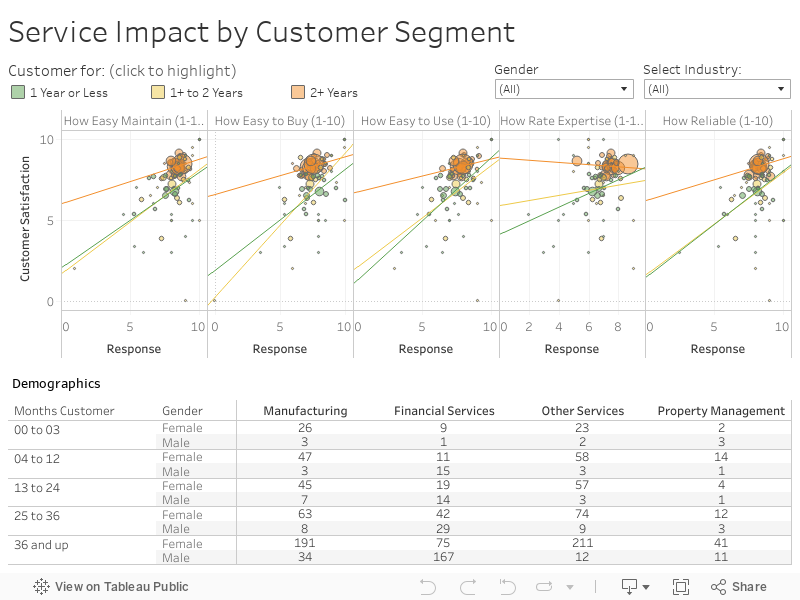
How your customers feel about your services is all that really matters. Tableau lets you bring together many types of data to get new insights on this critical measure. In this visualization, years as a customer is used as a segmenting variable for a customer satisfaction survey. Drill down into industry results with a click, or hover over different bubbles on the chart to find problem areas and successful efforts.