
Tableau as the Company-wide Platform
Instantaneous, intuitive data visualization
Large reduction in data aggregation time
Background to Implementation
Struggle to achieve self-service Business Intelligence
TDK Group continues to utilize technology to give back to society and achieve a sustainable, happy community. At present, under the Digi-TDK banner, we are moving ahead with two types of transformations, “Energy Transformation (EX)” and “Digital Transformation (DX),” to accelerate our sustainability initiatives. Active utilization of data plays a key role in sustaining these efforts.
“There was already a strong awareness of the importance of making decisions based on data,” said Takao Aoki, who is responsible for business intelligence-related systems in TDK’s Information Systems Division and is currently leading the Tableau Implementation Team in the Business Systems - Operational Support Group. However, before the implementation of Tableau, Excel VBA was the primary tool used for in-house development. Although there was an effort made to implement BI products, users were not able to make use of them as well as anticipated, and users often ended up performing analysis with Excel sheets.
“We did provide some tools developed from scratch for VBA or the web, but they were not good for data visualization. Even if the tools were used to output cross tables, it was common practice for users to run that data through Excel as a secondary process,” said Aoki. “In addition, we also actually tried out other products for which we had licenses and tested other similar well-known tools in the self BI sector, but we never quite managed to enable completely unrestricted self-service analysis of data.”
Tableau Implementation and Operation
From a single division to a company-wide platform
One day, a division head came to Aoki with a question. “My subordinates are having a lot of their time every month eaten up by data analysis. Some people have recommended Tableau recently. Could we use that?” Aoki’s team took this and offered the division head an improvement idea using Tableau Desktop. This idea ended up being a success that satisfied users.
Later, the Marketing Division also expressed interest in using Tableau, and Tableau Server was installed. In 2019, the service was expanded throughout the entire company and has become TDK’s standard BI platform. Tableau usage has been skyrocketing ever since, reaching around 1,100 users and over 10,000 monthly accesses in July 2021.
One particularly active hub of Tableau use has been the Communication Devices Business Group, which is responsible for the production of 5G chip antennas at the Electronic Components Business Company.
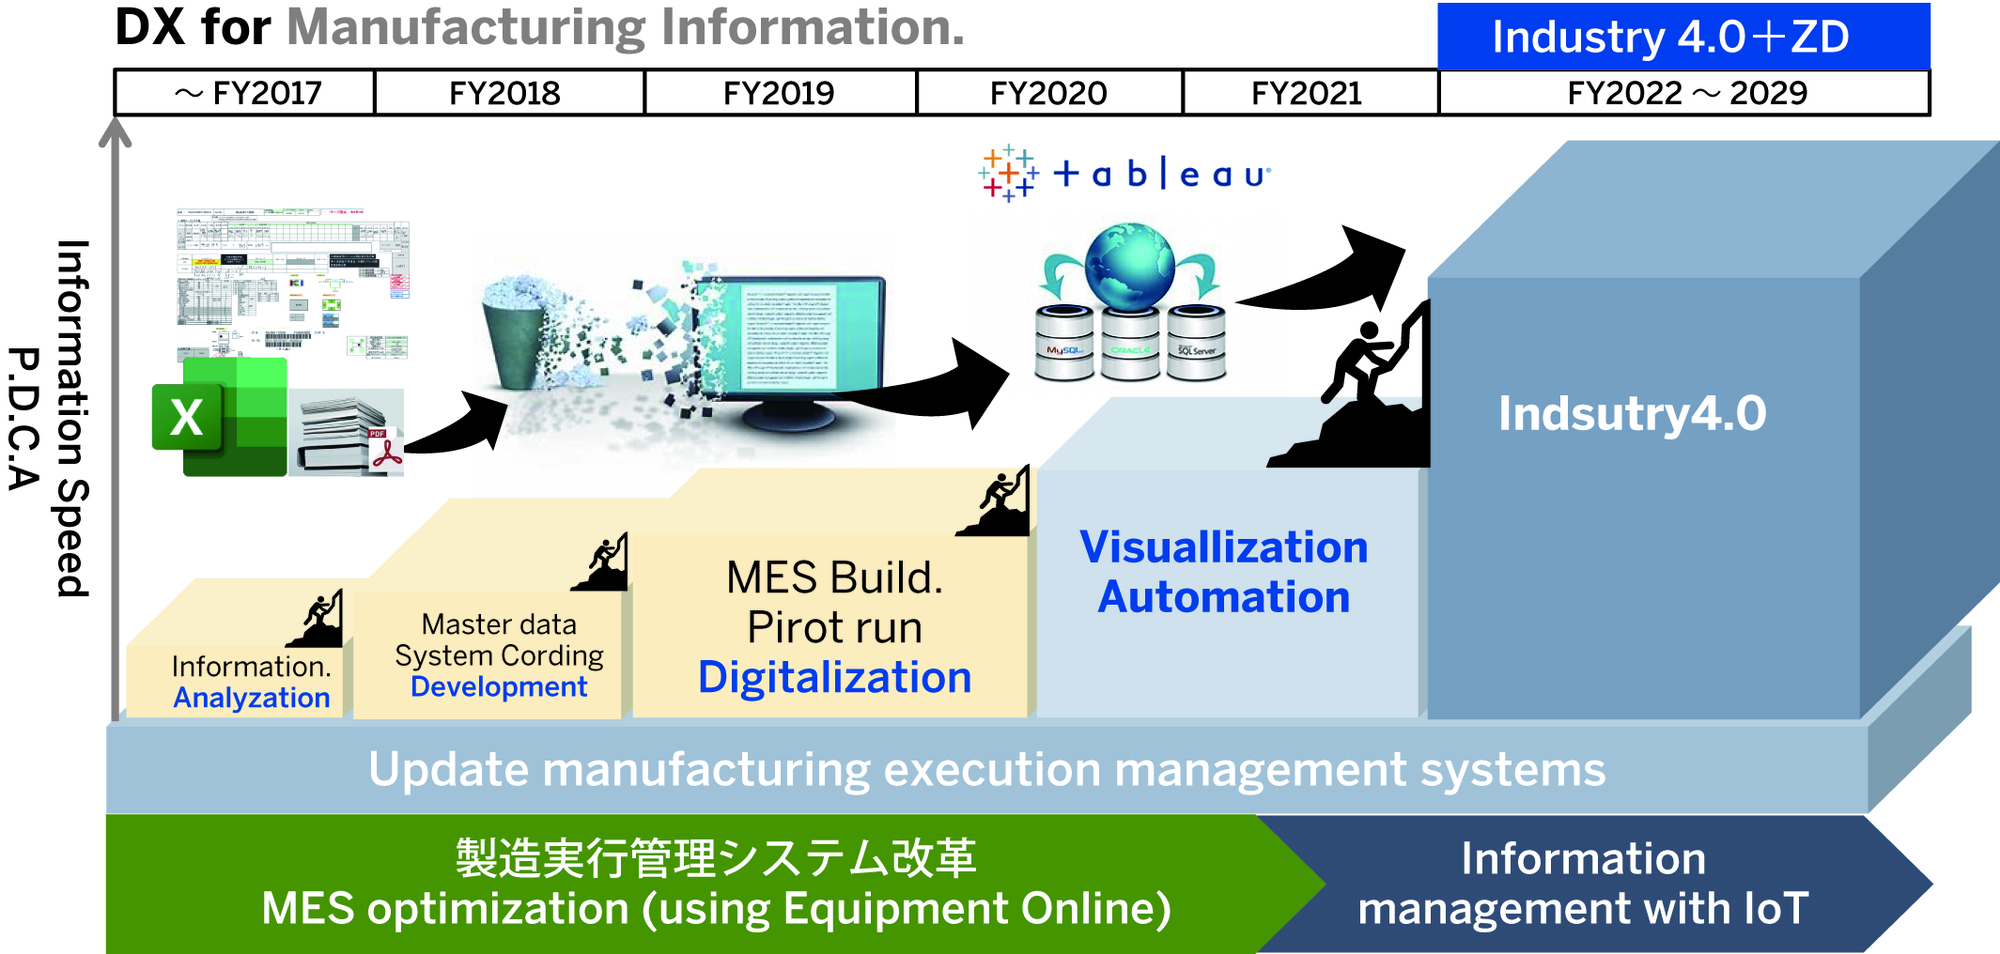
Manabu Echigoya, head of the Production Technology Department in Mobile RF Components Supervision in the same group, explained as follows. “We used Tableau Prep Builder to combine into a single database the log data / process performance data saved on the Oracle database and the product information data saved on PostgreSQL. We then published that to Tableau Server for analysis. Tableau is easy to use, so there’s a constant flow of data to analyze. We’ve been working on IoT for five years now, but I think it’s thanks to Tableau that our analysis platform is finally in place.”
Extremely fast response times. Graphs are displayed quickly and external data sources are imported promptly as well.

Why Tableau?
Intuitive operations and graph visuals make self-service easier
There are three major reasons why Tableau was adopted as the company-wide BI platform.
The first is how intuitive it is to operate. “To achieve self-service BI, the user needs to find the tools easy to use,” said Aoki. Since Tableau is similar in concept to a pivot table in Excel and intuitive to use, it is simple to select filters and there are many variations of formulas available.
The second reason is the beautiful visualizations. Even with default settings, Tableau creates attractive graphs that draw users’ interest, said Aoki.
According to Satoshi Tsukiyama, Section Head in the Production Technology Department for Mobile RF Components Supervision (Communication Devices Business Group), the third reason is “the importance of rapidly importing massive amounts of data from a wide range of data sources. Even big data with tens of millions of rows can be published using Tableau in just a few minutes.”
What was previously just a vague image can be clearly visualized as data. Colors can be assigned to various data items to reveal previously hidden trends, and it’s easier than ever to compare data with offices overseas.

Benefits of Tableau Implementation
Using data to accelerate improvements
Echigoya and Tsukiyama describe the benefits of Tableau usage as follows.
Instantaneous, intuitive data visualization
“Tableau enables us to easily visualize data,” said Tsukiyama. “We could of course make graphs in Excel, but Tableau enables us to make graphs instantly and more intuitively. In terms of the user experience, it is ten times faster and allows a lot of freedom. Even though I can’t program, Tableau makes me feel like I’ve become a programmer.”
Large reduction in data aggregation time
“We managed to really cut down on data aggregation time,” said Echigoya. “Previously, we would spend days cleaning our data in Excel, but now it’s done in a flash. For some tasks, this has cut down work hours by 99%. Personally, I am completely enamored with Tableau Prep.”
Changes how we view data
“You can only show results on Excel sheets, but with Tableau you can really dig into the background of those results,” said Echigoya. “You can also automatically tabulate equipment utilization rates and process yield rates, as well as show the latest data for each day in Viz. As a result, it’s easier to determine the causes of problems when they arise, and we’ve drastically lowered the amount of time it takes to make improvements.”
I dream of a day when we can look at the same Tableau screen not just within a plant but worldwide, sharing data with overseas offices to conduct various conversations based on that shared perspective.

Future Developments
Links all data for full visibility
“Our vision for the future is to achieve end-to-end product traceability by linking the entire process from ordering to production, inventory, sales, and shipment,” said Tsukiyama. If this process could be visualized, he said, then the PDCA cycle could be moved through more quickly. “We would also like to work on production capacity simulation based on data analysis in order to better serve ever-changing customer demands.”
“Ideally, all data would be linked together,” said Echigoya. “Not just internal factory data or internal company data, but also market data from outside the company. I expect that Tableau will fulfill an important role as a platform that connects all of this data together.”
Aoki said that in the future, they will develop more data sources to import into Tableau to better handle these kinds of requests from business divisions. “All of the data we want is already on the Tableau Server, so what’s left is simply selecting an analytical approach. The Tableau Implementation Team is going to focus on building up the environment to be able to provide this system on a global scale.”
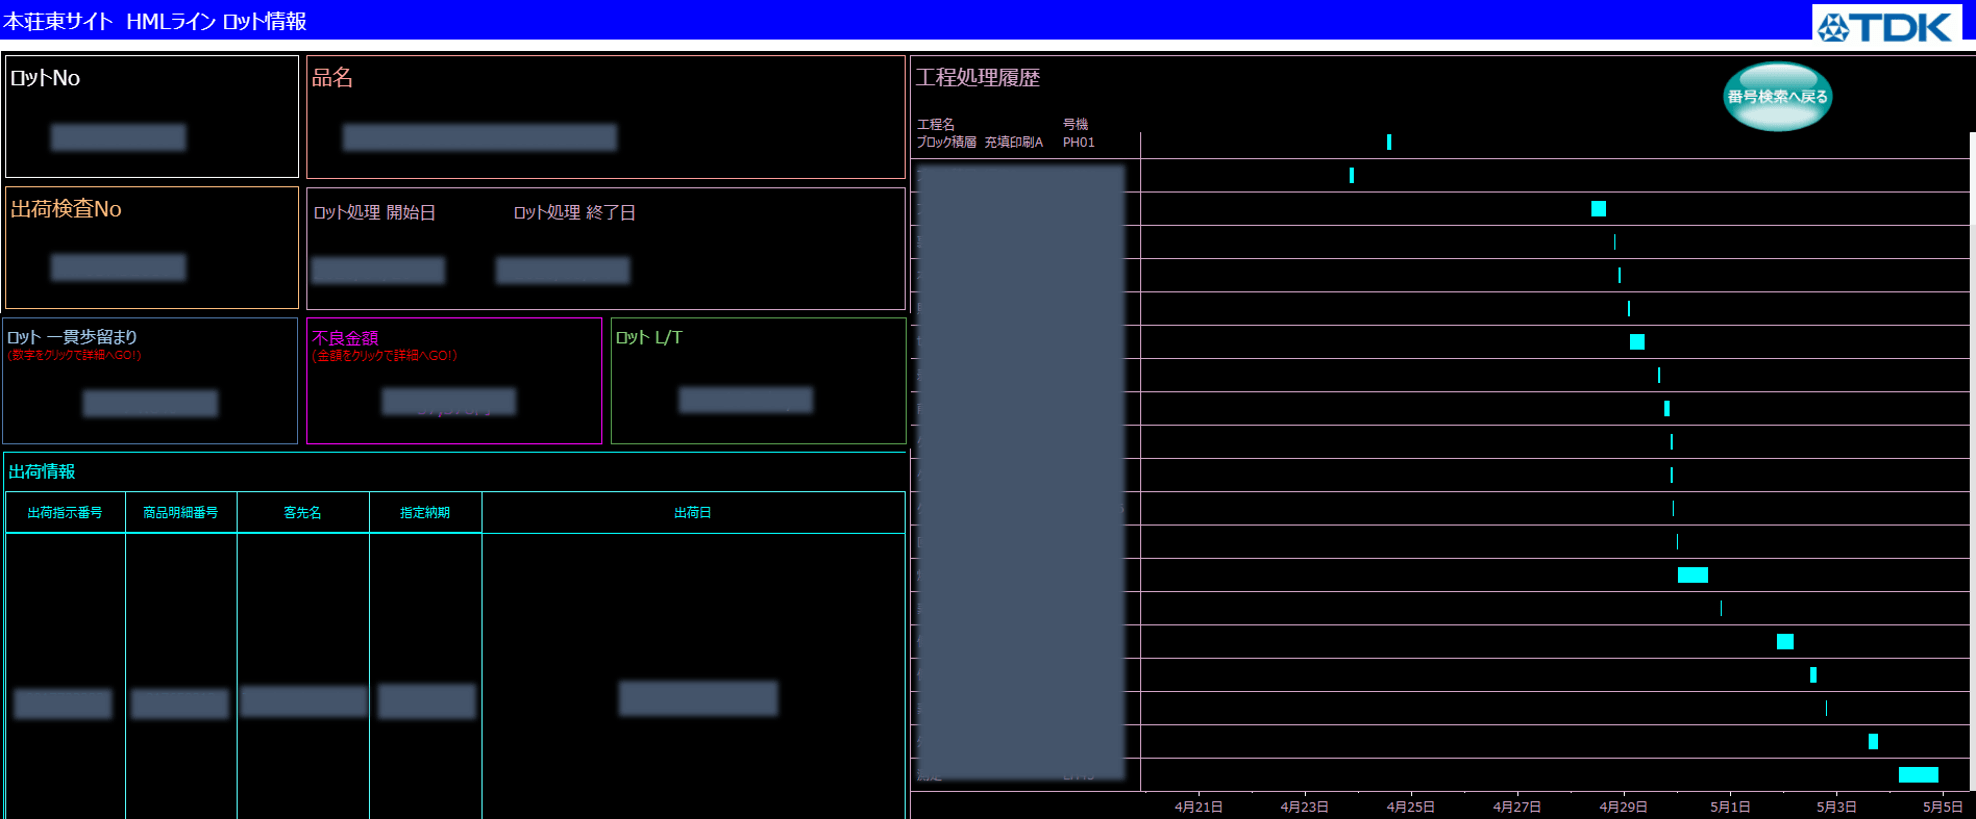
The TDK Communication Devices Business Group is using Tableau to visualize factory production status, shipping information, and other data.
Data aggregation work is no longer necessary, and everyone is able to look at the data they need whenever necessary.