
Emami moves from basic MIS reporting to visual analytics and automation with Tableau
Dashboards are refreshed automatically and available for business consumption by the second day of every month.
150 employees using Tableau, increasing from just 20 in two years.
67 visualizations, helping employees across the business make data-driven decisions
Established in 1974, Emami is a leading personal care and healthcare business in India whose vision is to naturally make people healthy and beautiful. The business has a portfolio of more than 300 products which it sells into 60 countries under brands such as Navratna, BoroPlus, and Zandu. Tableau helps Emami measure brands' health and performance and has played a central role in maturing the business' use of analytics.
According to Sudipta Mukherjee, Deputy General Manager of SAP BI and Analytics Projects at Emami, the business started its data journey in 2012. However, for many years, reports were compiled using spreadsheets and took too long to prepare.
In 2016, we set up a Business Intelligence Centre of Excellence, and one area of focus was to automate the monthly reporting process. It took up to ten days to prepare reports manually, which meant we were losing a lot of time when it came to making decisions or corrections based on the last month's data.
Emami wanted to speed up reporting by providing each department with dashboards that could be refreshed automatically by pulling information straight from its data warehouse. It also wanted to make use of predictive analytics rather than always looking at the past.
This is when CRG Solutions, a leading Tableau partner in India, stepped in to convert Emami’s vision into reality.
With CRG’s help, the business chose to roll out Tableau because of its broad visualization capabilities. In evaluating Tableau alongside other analytics tools, Emami also found that it was the easiest to use.
"Tableau stood out for the simplicity with which users can interact with the user interface and get their questions answered," said Mukherjee.
Building a data culture
Establishing Tableau as its analytics platform has allowed Emami to move towards a self-service model for analytics. Departments no longer need to wait ten days for month-end reports. Instead, they can simply click to refresh dashboards on the second day of each month. They also better appreciate the value of using data in their day-to-day decision making.
CRG supported Emami in advancing its use of analytics and building its data culture. "When we started with Tableau, there was some hesitancy about using a new platform, but CRG helped us engage people through workshops, which led to a steady stream of requests for dashboards and visualizations," Mukherjee.
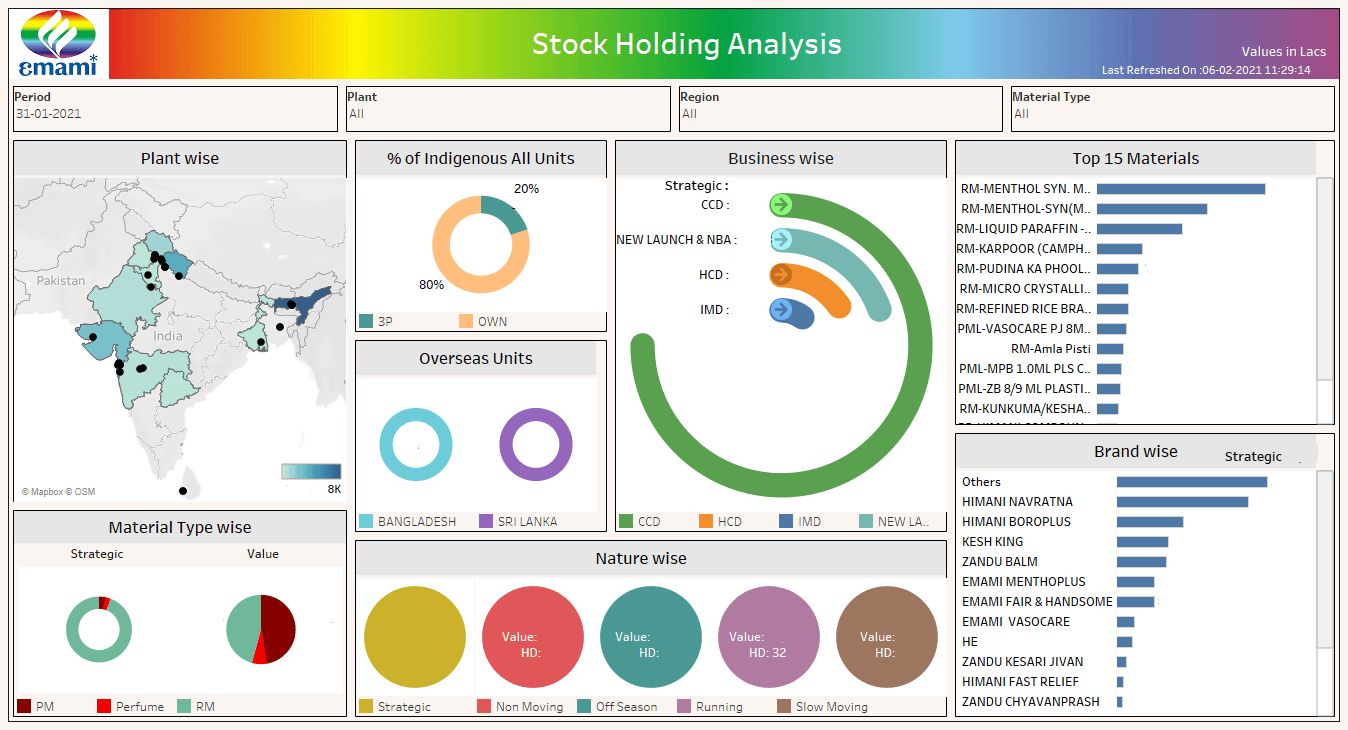
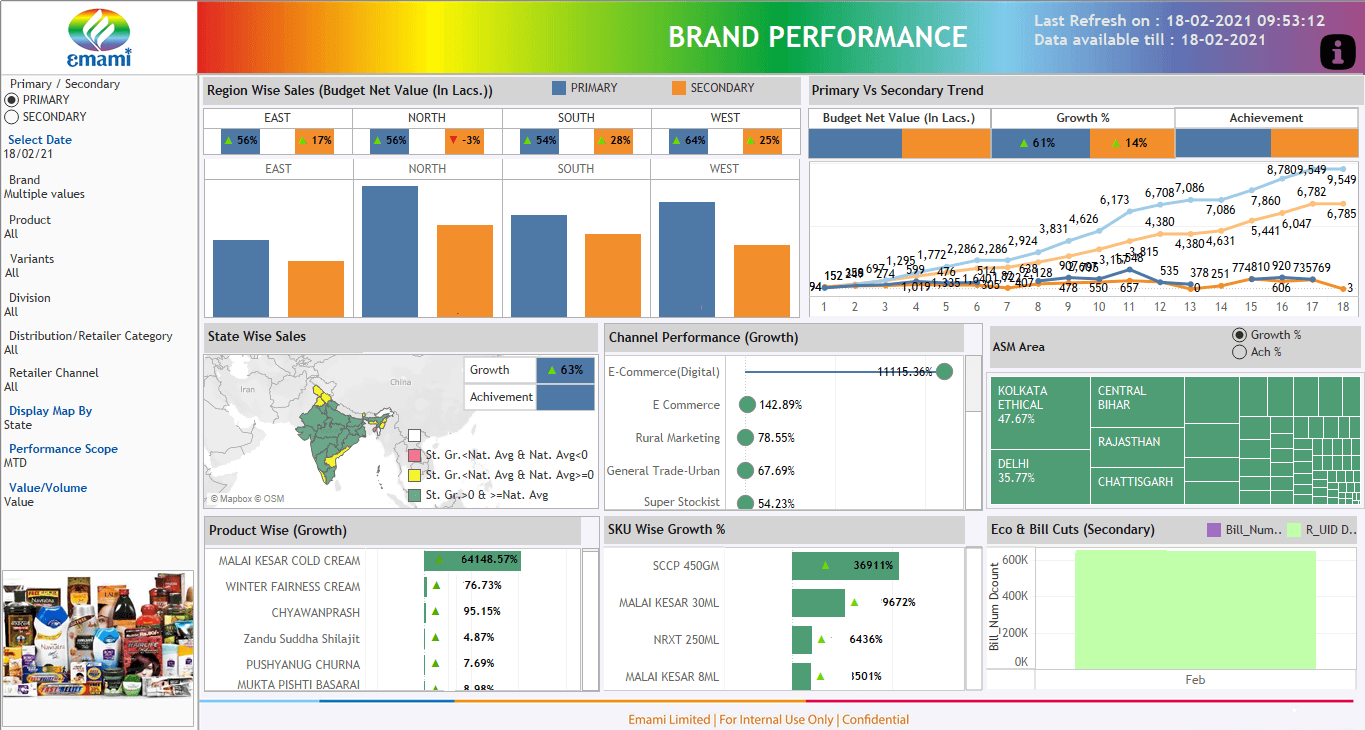
Emami now has 150 employees using Tableau to visualize a wide range of performance metrics. These include product sales by region and by channel. Emami also has a brand heatmap that it can drill down into to understand which brands generate the most growth. These insights help the business make better decisions about where and how it sells products. For example, knowing which products are performing well in each region Emami can make data-driven recommendations to retailers on what they should purchase to sell in their stores. Emami can also pinpoint any loss of sales across regions by visualizing brand, product, and SKU data and using a decision tree for root cause analysis.
Other visualizations help Emami track financial and operational metrics. For example, the business can see all purchase orders at a glance and drill down to investigate those which have been open too long. It can also monitor productivity and operational hygiene.
Mukherjee said that the visualizations in Tableau had been particularly useful in analyzing business changes during COVID-19 and been used by some teams to conduct virtual business review meetings. He shared that Emami is now focused on making more use of predictive analytics. Advanced analytics use cases include providing sales reps with cross sell and up-sell recommendations and optimizing sales routes to improve Market Representative productivity and Market Representative sales success rates.
"We have gradually moved up the value chain from ad hoc descriptive analytics to self-service visualizations and are now moving towards predictive analytics which will help us optimize our business activities," said Mukherjee.