Best of the Tableau Web: New bloggers and the latest data tips
It’s the first Best of the Tableau Web for 2019! Dive into the latest and greatest from the Tableau Community.


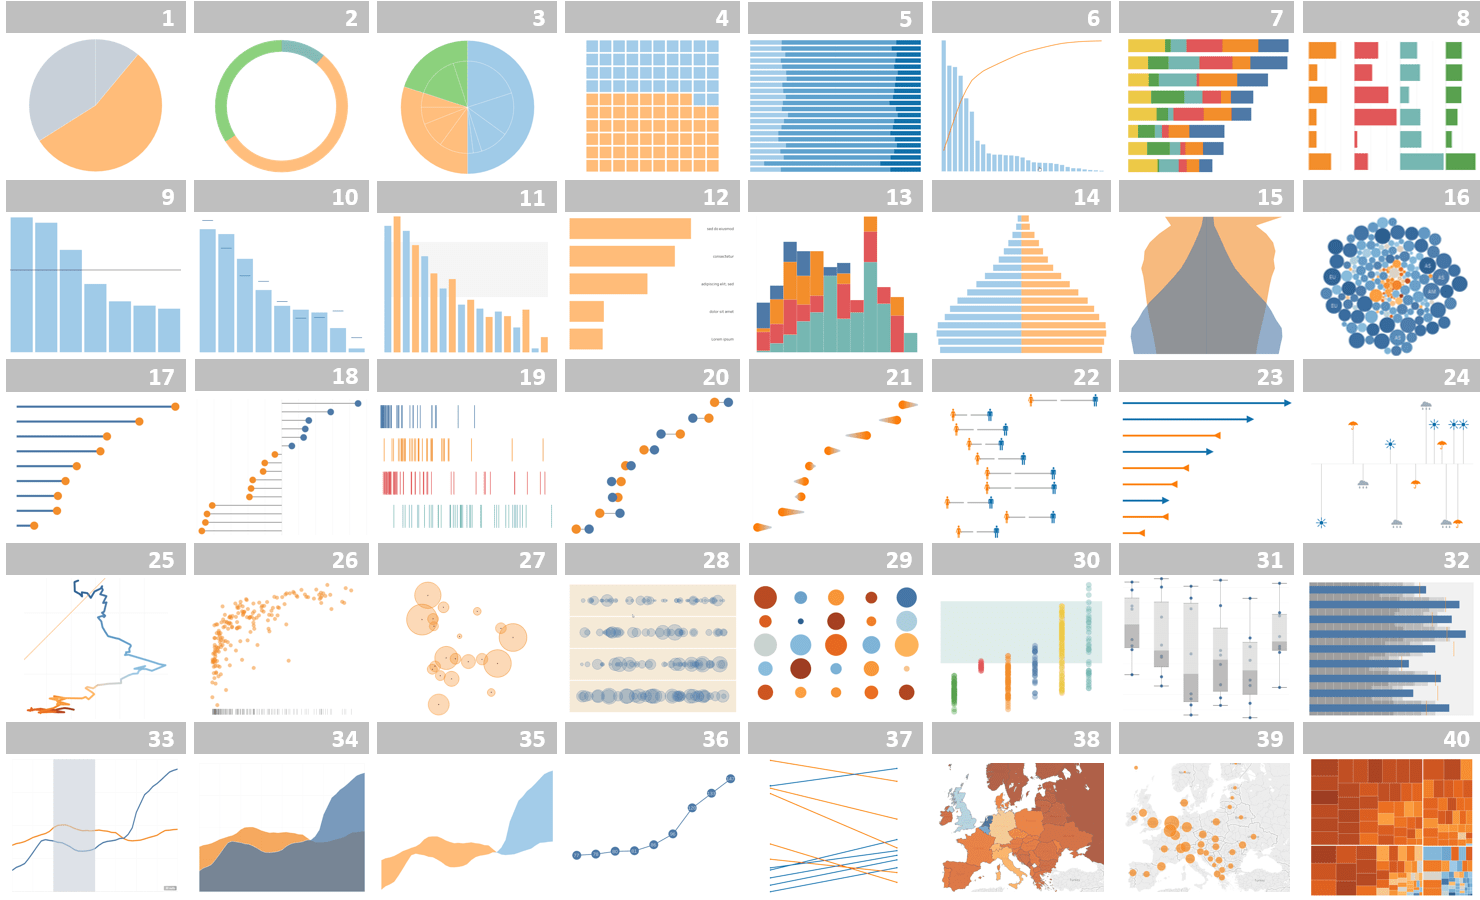
Jorge Camoes' Wordless instructions for making charts: Tableau Edition
It’s the first Best of the Tableau Web for 2019! We’ve got a double bill for you this month because we skipped a month. That just means you’ll need two cups of tea to drink while going through all this great content.
Is your blog on my list?
As we kick off Best of the Tableau Web for 2019, I wanted to be sure I’m following all the Tableau blogs. I keep track of things on Twitter and LinkedIn, but I also use Feedly as a feed reader. Is *your* blog in my list? Check out the list of feeds here. If you don’t see your blog, tell me about it here.
One more notice. Starting next month, I will be splitting the “Tips and Tricks” section up. I’m going to create a section for “Design and Formatting” and a separate section for “Calculations.” That should prevent any section from becoming too large.
Are there any other changes you’d like to see?
We want to hear from you! Please submit feedback about what you’d like to see in Best of the Tableau Web for our 7th year (wow!) and I’ll share the results in the next month’s post.
Alright, now go grab your second cup of tea and dive into this month’s content:
Inspiration
The Excel Charts Blog Wordless instructions for making charts: Tableau Edition
Data Bard Tapestry Conference: the blog post
David Velleca You're my 'Vizspiration' - Finding Inspiration from the Tableau Community
Sons of Hierarchies 2018 Year in Review
Ryan Sleeper Year in Review / Top 10 Tableau Tutorials of 2018
Ellie Mason DS11 Dashboard Week // Day Two: NOPD Body Wearable Cameras
Viz Zen Data Looking Back at the Amazing 2018
THE MARKS CARD Video: Things I Know About Tableau Layout Containers
mikevizneros Unasked Questions
Andy Kriebel How to Approach Analysis & Design Dashboards
Medium by Emily Tableau Community is like a Significant Other
Sciolistic Ramblings The Making of “Fallen Leaves….”
Data Tomato Workout Wednesday – week 2, 2019
DataPlusScience Bar Hopping: Theme and Variations on a Bar Chart
TableauFit The Logic of Dashboards: Designing for the Whole Picture
Data Revelations Good enough, good enough, good enough, and *not* good enough
Dueling Data 5 Types of Dashboards
Tips and tricks
Seffana Mohamed-Ajaz How to make a butterfly chart using Tableau
Gregg Rimmer Creating a custom geographical role using other dimensions in Tableau
Brian Scally Tableau: Simultaneous continuous and discrete colour schemes
Diego Parker Dynamically Controlled Bins
Manuela Marolla LODs vs Table Calcs: How to compare the profits of all the Sub-categories to that of the selected one?
Maleeha Ahmed Common Baseline Graph With Parameter (Part 2)
Thomas Luthi Using LODs to Calculate Customer Retention
Jack Parry Using YoY change to colour shapes on a line chart
MY DATA MUSINGS #WorkoutWednesday | 2019 | 3
Kevin Flerlage Posting Your Viz: Ability to Scroll & Zoom with a Perfect Thumbnail
Harry Cooney Tableau’s Order of Operations
Code
once-returner tableau-datasource-autodocs
alexloth.com How to research LinkedIn profiles in Tableau with Python and Azure Cognitive Services
Jamie Gough Drivetime analysis in Tableau using R
Viz Simply Let's Make a Tableau Extension
Jedi
DataViz.LoVe Parallel Coordinates in Tableau
The Stats Ninja How to Create a Residual Plot in Tableau
Louise Le Tableau Tip: Stop Your Viz In Tooltips From Being Filtered
VIZJOCKEY Building a tournament flow in a single-elimination & exponential tournament structure
Tableau and Behold! Hierarchical Row Level Security Best Practices
Server
관련 스토리

DataFam Roundup June 2026

DataFam Roundup May 2026

Iron Viz 2026: Read Between the Data
 2026/05/28