Prospitalia h-trak brings data-driven efficiency to critical care
50 health care customers making data-driven decisions to optimize spending
One customer has reduced annual spending by 9%, which is the equivalent of $7M
Personal Protective Equipment (PPE) dashboard developed in one week to help customers maintain supply during the pandemic
Prospitalia h-trak was founded in 2002 to help healthcare providers capture and manage their data for purchasing, billing, and reporting. The company’s flagship product is h-trak which allows customers to gather critical data at the point of care, including details of any consumables used during surgery. Combined with h-trak’s powerful and flexible reporting capabilities, this helps hospitals and other healthcare providers manage their inventory and streamline administration.
“Data is at the cornerstone of everything we do and key to the service we provide our customers,” said Kirk Kikirekov, Managing Director of Prospitalia h-trak. “There are more than 1.4 million products used in critical care environments such as pacemakers and knee implants.
Our customers need accurate information on how much they cost and how much insurers will pay. They also need to track and analyze how much they are consuming and spending, so they can be as cost-efficient as possible,” Kikirekov continued.
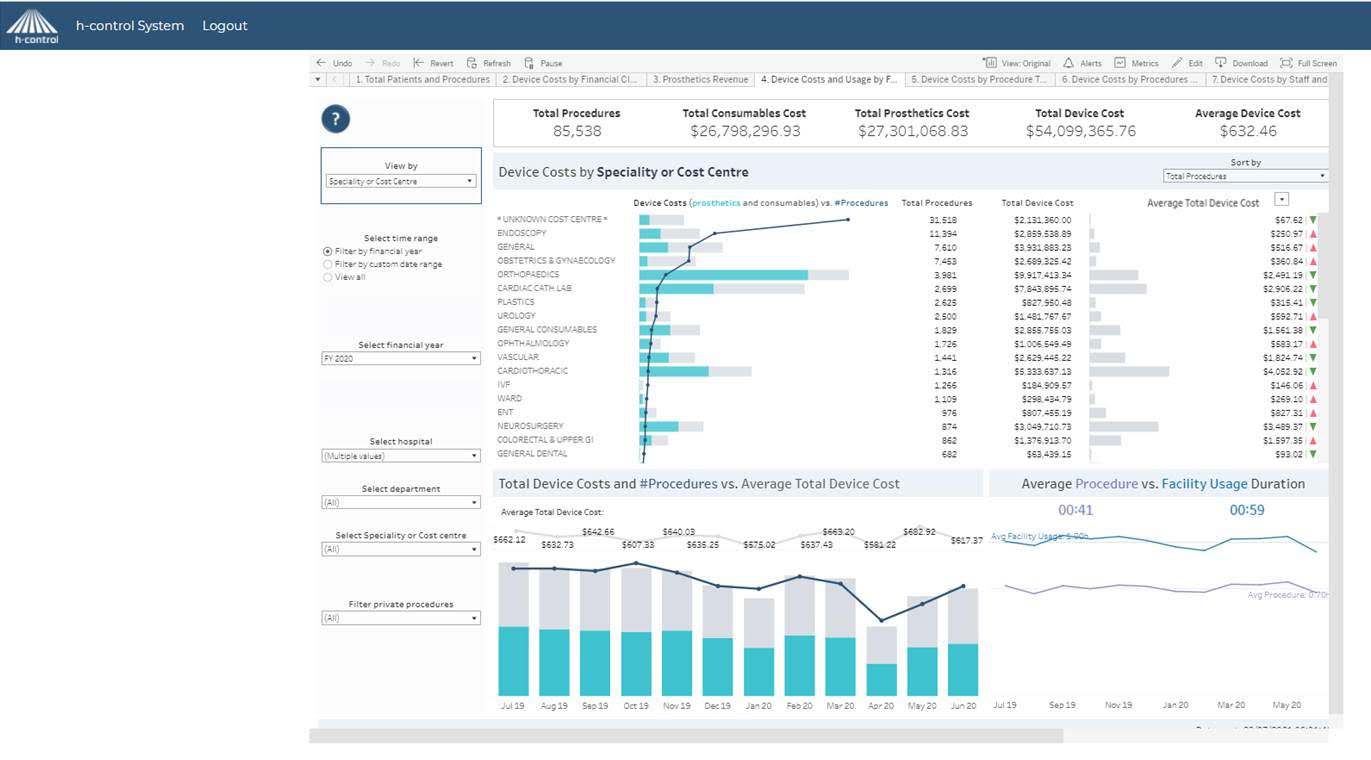
A new solution from Prospitalia h-trak helps to deliver these insights in real-time. Known as h-control, the solution leverages embedded analytics from Tableau to help customers reduce spending by as much as 10%.

Unlocking more value from data
With h-control, Prospitalia h-trak wanted to provide the industry with a level of insight not possible with any other reporting tool.
To achieve this, the company needed a solution that would allow it to take the data within h-trak and make it easier for customers to explore and quickly spot things like variations in spending, spending trends, and contract compliance.
A previous analytics solution used by Prospitalia h-trak required too much coding to extend visualizations to customers. Tableau offered a flexible alternative with local support for the Australian business.
“Another thing we liked about Tableau is that the visualizations you can create are quite powerful,” said Kikirekov. “It gave us an opportunity to re-imagine the story we are trying to make with data so that our dashboards are even more useful for our customers.”
Prospitalia h-trak has since streamlined the creation of dashboards using Tableau’s embedded analytics platform. Kikirekov explained that every night, customer data was uploaded from h-trak by creating an XML file that’s transferred to a database connected to Tableau. This allows for the automatic refresh of dashboards within the h control product.
The onboarding process with the h-control product is also very simple. Prospitalia h-trak simply creates the user accounts for our customers on the h-control system and then carries out a one-to-two-hour training session with customers.
Customers now have data at their fingertips to understand how much they’re spending on different products and procedures and pinpoint opportunities to control costs. One local health district was able to use the insights gained to reduce costs by $7M, which was 9% of its annual spend on consumables and implants.
“Prospitalia h-trak is deeply involved with our customers on an ongoing basis, and we partner with them to provide continual advice and insights to improve their understanding of their data, and therefore improve their business,” said Kikirekov.
Data is at the cornerstone of everything we do and key to the service we provide our customers.
New opportunities to innovate
Prospitalia h-trak has hired an internal developer to build and enhance its dashboards and create new ones in response to customer needs.
One of these was a dashboard to help a local health district track Personal Protective Equipment (PPE) during the COVID-19 pandemic. The customer had initially tracked PPE within a spreadsheet, but by using Tableau, it was easier to visualize supply and ensure items were reordered before they ran out.
“The demand for PPE was 10x higher than it had ever been and there was a lot of nervousness about running out. The dashboard helped to alleviate the customer’s concerns and ensure demand was met,” said Kikirekov.
Prospitalia h-trak is now investigating how it can apply data to help customers optimize and standardize their contracts. Tableau’s embedded analytics platform will help to power this solution and uncover more opportunities for health care providers to maximize their volume-based contracts.
Moving forward, Kikirekov would also like to help customers be more proactive and use their data for scenario planning.
“A lot of what we do is based on historical data, but we now want to use historical data to predict the future by modelling scenarios to enable better forecasting and planning,” said Kikirekov.