DataFam Roundup: January 1–5, 2024


Welcome! Dig into this week's DataFam Roundup—a weekly blog that brings together community content all in one post. As always, we invite you to send us your content—and the DataFam content from your peers that have inspired you! Find the content submission form here.
Community Highlight
To recognize new and consistent Tableau contributors—we’re excited to have a section within the weekly DataFam Roundup called the Tableau Community Highlight. Find out how to get involved.

Jacob Rothemund, Data Visualization Specialist at Datacom
Sydney, Australia
Jacob Rothemund is a Data Visualization Specialist at Datacom. He is involved in many areas of the Tableau Community: staying active on the Tableau Forums, participating in Community Projects such as Workout Wednesday, participating in Tableau User Groups, publishing content on Tableau Public and sharing tips and tricks on X and Linkedin.
Early in his Tableau journey, Jacob attributes a lot of his learning to trial and error and online tutorials but joining Tableau User Groups, and leveraging content on social media, blogs, and Tableau Public helped him increase his knowledge level exponentially in a short period of time.
One of Jacob’s focuses now is sharing his knowledge on X and Linkedin. He finds that this is an easy way to contribute tips and ideas and build connections. Jacob also engages on the Tableau subreddit by answering questions and interacting with the community there. Most recently, he also presented to the Tableau Community at Vizit Sydney.
Connect with Jacob on Linkedin, X, and Tableau Public.
DataFam content
Dive into content created by the Tableau Community:
-
Action Analytics: Mental Model #6: Many Levels of Detail
-
The University of Sydney: Meet the 2023 Matilda data visualisation competition winners
-
Deepak Holla:
-
Adegboyega (Vividus): A Beginner’s Guide to Tableau Blending
-
Ivett Kovács: #BigLittleTips -Practical Tableau Tips_03
-
Hfahmida Data Science and Business Analytics:TRIDS: Analysis of Superstore Sales Dataset
-
Sadie St. Lawrence, The Data Leadership Collaborative: Data Trends in 2024: 5 to Watch
-
Oliver Linley, OneNumber: Swap Between Measures with Different Number Formats in Tableau
-
Serena Purslow, The Data School: From Data to Design: The Process of Building a Dashboard
-
Aanchal Soni:
-
Data Ideas: Data Alchemy: The Path to Mastery (with Chris Williams, Alteryx Ace & Tableau Ambassador)
-
Marc Reid, Dataviz Blog: Filter a Tableau Dashboard using Salesforce
-
Tatyana Nikolova: How to find the max and min values
-
Sean Miller, HipsterVizNinja: #WOW2024 Tableau Live Stream - HR Analysis
-
Rajeev Pandey, vizartpandey: 30 Best Design Resources for Your Next Tableau Dashboard
-
Chaitanya Kulkarni: 100 YouTube Subscribers Celebration🎊with Tableau Visionary Adam Mico
-
Srutimala Deka: A Practical Guide to using LODs in Tableau
Team Tableau
-
Practice and Grow Your Data Skills with Tableau Community Projects
- Explore the 2024 Iron Viz Entries
- Transforming Ideas into Features: Tableau's Commitment to Community-Driven Innovation
Upcoming events and community participation
-
Apply or Nominate to Become a 2024 Tableau Visionary by 11:59 PM (PT), Thursday, January 11, 2024.
-
Lights, Camera, Action: Tableau and IMDb Launch Data Visualization Campaign for Movie Lovers
-
2024 Iron Viz Qualifiers: Top 10 Results January 17, 2024, 9:00 AM (PT) Virtual Event - Find out the top 10 Tableau Public visualizations, including the 3 finalists selected to compete in the 2024 Iron Viz Championship.
-
READY TO SUPERCHARGE YOUR DATA SKILLS? The Information Lab has free, on demand training courses will help you to make sense of your data and take you from zero to data hero. Developed by our industry leading trainers, our expansive courses cover the basics to intermediate levels of Tableau, Alteryx and Tableau Prep! You can take advantage of the whole course or simply choose the modules you need to brush up on your skills. Start your data journey today by simply selecting your training course below.
-
Demystifying the way to learn Data Visualization! Are you looking for a way to learn Data Visualization and feeling lost? We all have been there and I am going to help you understand the fundamentals and look for a way to learn data visualization.
-
Viz Collab: Hello everyone! I’m excited to be opening #VizCollab back up for another round of matches! In the last year I matched around 40 people for some amazing vizzes, including Viz of the Days and a viz that was featured in a local publication. So if you want to find a collaboration partner sign up.
Vizzes
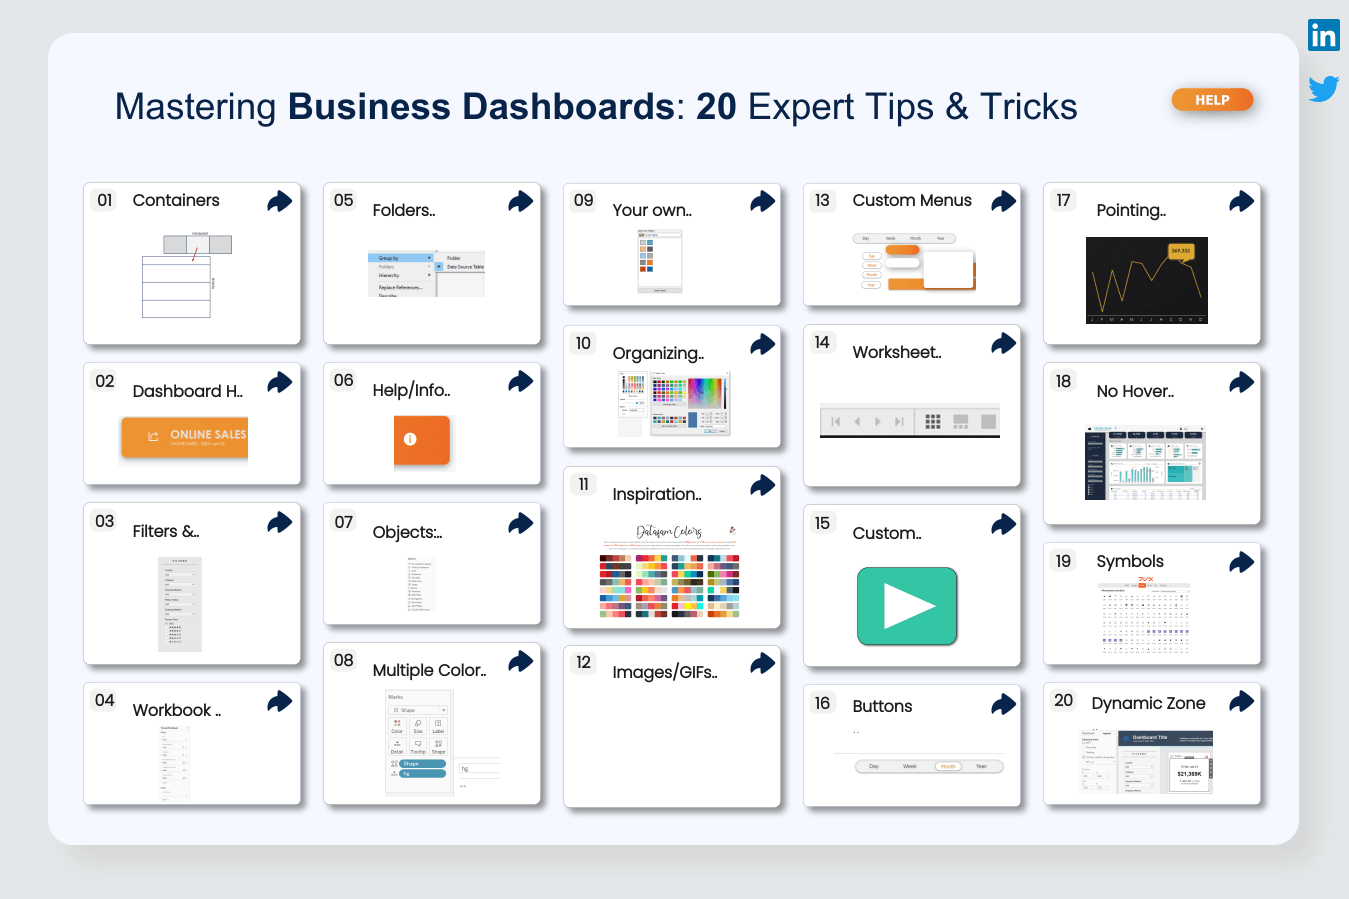
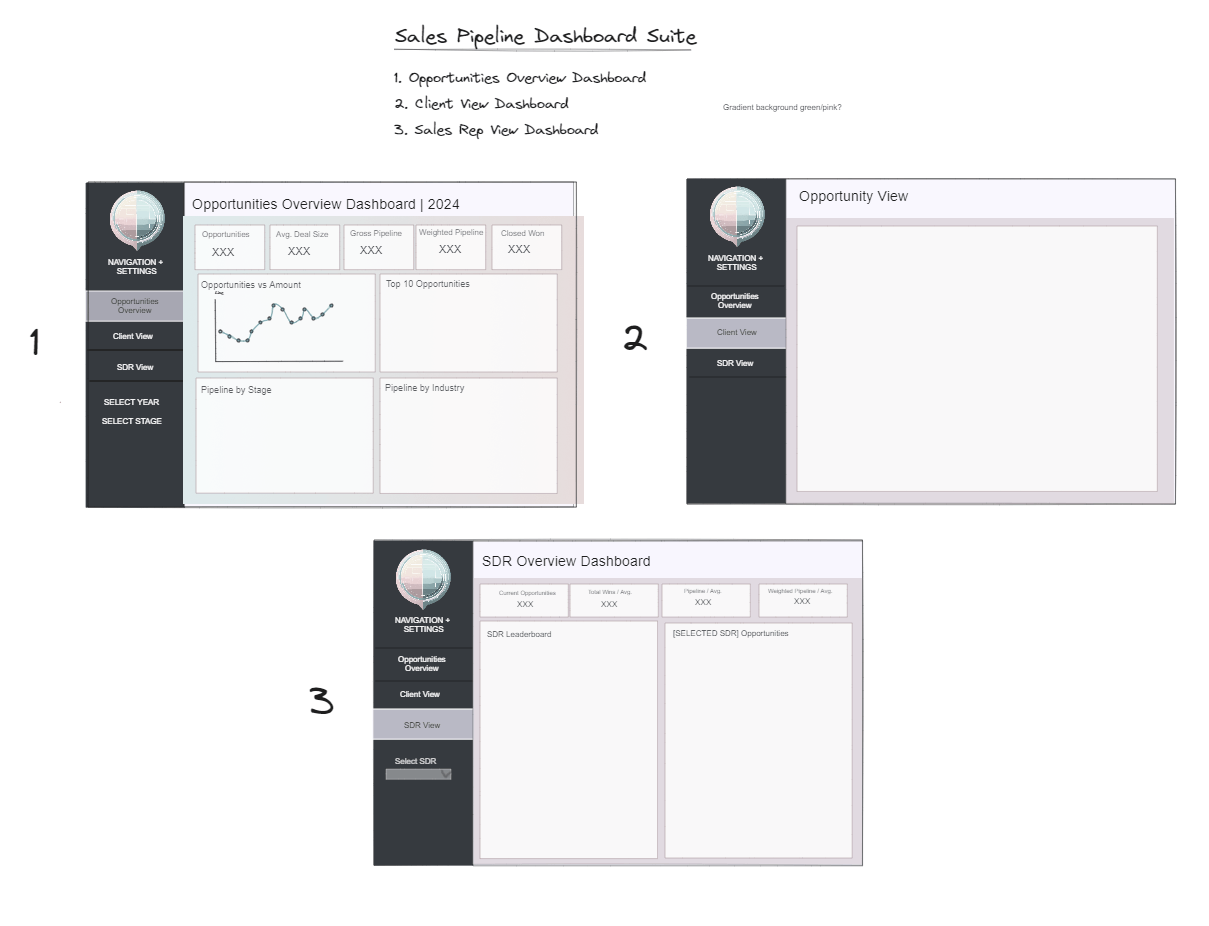
Adrian Zinovei: Top 20 Business Expert Tricks
See the latest Viz of the Day, trending vizzes, featured authors, and more on Tableau Public.
Check out some inspirational vizzes created by the community:
-
Diaz Prasetyo: Music Taste and Mental Wellbeing
-
Adrian Zinovei: Top 20 Business Expert Tricks
-
Keren Aharon: Data Visualization Catalogue
-
Brittany Rosenau: Seven Years of Spotify
-
Lindsay Betzendahl: New Year's Resolutions 2024
-
Zainab Ayodimeji: Nollywood FIlm Club Scores | IrokoCritic
-
Naresh Suglani: F1 History | 1950 - 2023
-
Jacob Rothemund: Tableau Server Wrapped / Animated Multi-Page Dashboard Concept
-
Chaitanya Kulkarni: 100 YouTube Subscribers Celebration🎊with Tableau Visionary Adam Mico
-
Waqar Ahmed: The Phenomenal Atif Aslam
-
Deepak Holla: The Sheer Madness of the IPL 2024 Mini Auction!!!
Community Projects
Back 2 Viz Basics
A bi-weekly project helping those who are newer in the community and just starting out with Tableau. Not limited just to newbies!
Web: Back 2 Viz Basics
Twitter: #B2VB
Week 1: Build a Line Chart
Workout Wednesday
Build your skills with a weekly challenge to re-create an interactive data visualization.
Web: Workout Wednesday
Twitter: #WOW2022
Week 1: Can you compare salaries to the median?
Preppin' Data
A weekly challenge to help you learn to prepare data and use Tableau Prep.
Web: Preppin’ Data
Twitter: #PreppinData
Week 1: Can you compare salaries to the median?
DataFam Con
A monthly challenge covering pop culture and fandoms.
Web: DataFam Con
Twitter: #DataFamCon
January 2024: Award-Winning Pictures
EduVizzers
A monthly project connecting real education data with real people.
Web: Eduvizzers
December 2024: The State of School Feeding Worldwide
Games Night Viz
A monthly project focusing on using data from your favorite games.
Web: Games Nights Viz
Twitter: #GamesNightViz
November 2023: Disney's Stacked Bar
Iron Quest
Practice data sourcing, preparation, and visualization skills in a themed monthly challenge.
Web: Iron Quest
Twitter: #IronQuest
White Space
Storytelling with Data
Practice data visualization and storytelling skills by participating in monthly challenges and exercises.
Web: Storytelling with Data
Twitter: #SWDChallenge
January 2024: upskill with UpSets
Project Health Viz
Uncover new stories by visualizing healthcare data sets provided each month.
Web: Project Health Viz
Twitter: #ProjectHealthViz
October 2023: Customizing Shapes with Opacity in Tableau
Diversity in Data
An initiative centered around diversity, equity & awareness by visualizing provided datasets each month.
Web: Diversity in Data
Twitter: #DiversityinData
November 2023: Disney Demographics
Sports Viz Sunday
Create and share data visualizations using rich, sports-themed data sets in a monthly challenge.
Web: Sports Viz Sunday
Twitter: #SportsVizSunday
Viz for Social Good
Volunteer to design data visualizations that help nonprofits harness the power of data for social change.
Web: Viz for Social Good
Twitter: #VizforSocialGood
Real World Fake Data
Create business dashboards using provided data sets for various industries and departments.
Web: Real World Fake Data
Twitter: #RWFD
Session 6: HR Cross-Function Mobility
Makeover Monday
Create business dashboards using provided data sets for various industries and departments.
Web: Makeover Monday
Twitter: #MakeoverMonday
Data Plus Music
A monthly project visualizing the data behind the music we love!
Web: Data Plus Music
Twitter: #DataPlusMusic
Autres sujets pertinents

DataFam Roundup June 2026

DataFam Roundup May 2026

Iron Viz 2026: Read Between the Data
 28 Mai, 2026