DataFam Roundup: August 7–11, 2023


Welcome! Dig into this week's DataFam Roundup—a weekly blog that brings together community content all in one post. As always, we invite you to send us your content—and the DataFam content from your peers that have inspired you! Find the content submission form here.
Community Highlight
To recognize new and consistent Tableau contributors—we’re excited to have a section within the weekly DataFam Roundup called the Tableau Community Highlight. Find out how to get involved.

Sarah Pallett, Analytics Consultant
Los Angeles, USA
Sarah Pallett is an Analytics Consultant, her work focuses on building interactive dashboards to help organizations access and analyze their data. Sarah publishes content on her blog and Tableau Public and also participates in community projects including #MakeoverMonday and #WorkoutWednesday.
After publishing her popular “Pop Culture References in Ted Lasso” viz, Sarah encountered the perfect opportunity to begin her blog. Her goal in writing her first post was to describe her process and express gratitude to the Tableau Community for the inspiration and all the techniques and workbooks she got to explore via blogs and Tableau Public. Sarah’s focus now on her blog is to share the “inside scoop” behind how she builds particular vizzes and the vision behind them.
As an active creator on Tableau Public, Sarah draws inspiration from her love of sports journalism for many of her vizzes. Sports related news articles that peak her curiosity encourage a deeper dive into the subject area from which she begins building out datasets to answer her key questions. An example of this inspiration is in her NHL Ovechkin vs Gretzky viz.
Connect with Sarah on Linkedin, Twitter, Tableau Public, and on her blog.
DataFam content
Dive into content created by the Tableau Community:
-
Zainab Ayodimeji: How to Choose The Best Visualisation for You
-
Lindsay Betzendahl, Viz Zen Data: How to Create Tabs in Tableau Using Parameters and Dynamic Zone Visibility
-
Ken Flerlage, The Flerlage Twins: A Guide to Embedding Tableau # 3: The Embedding Playground
-
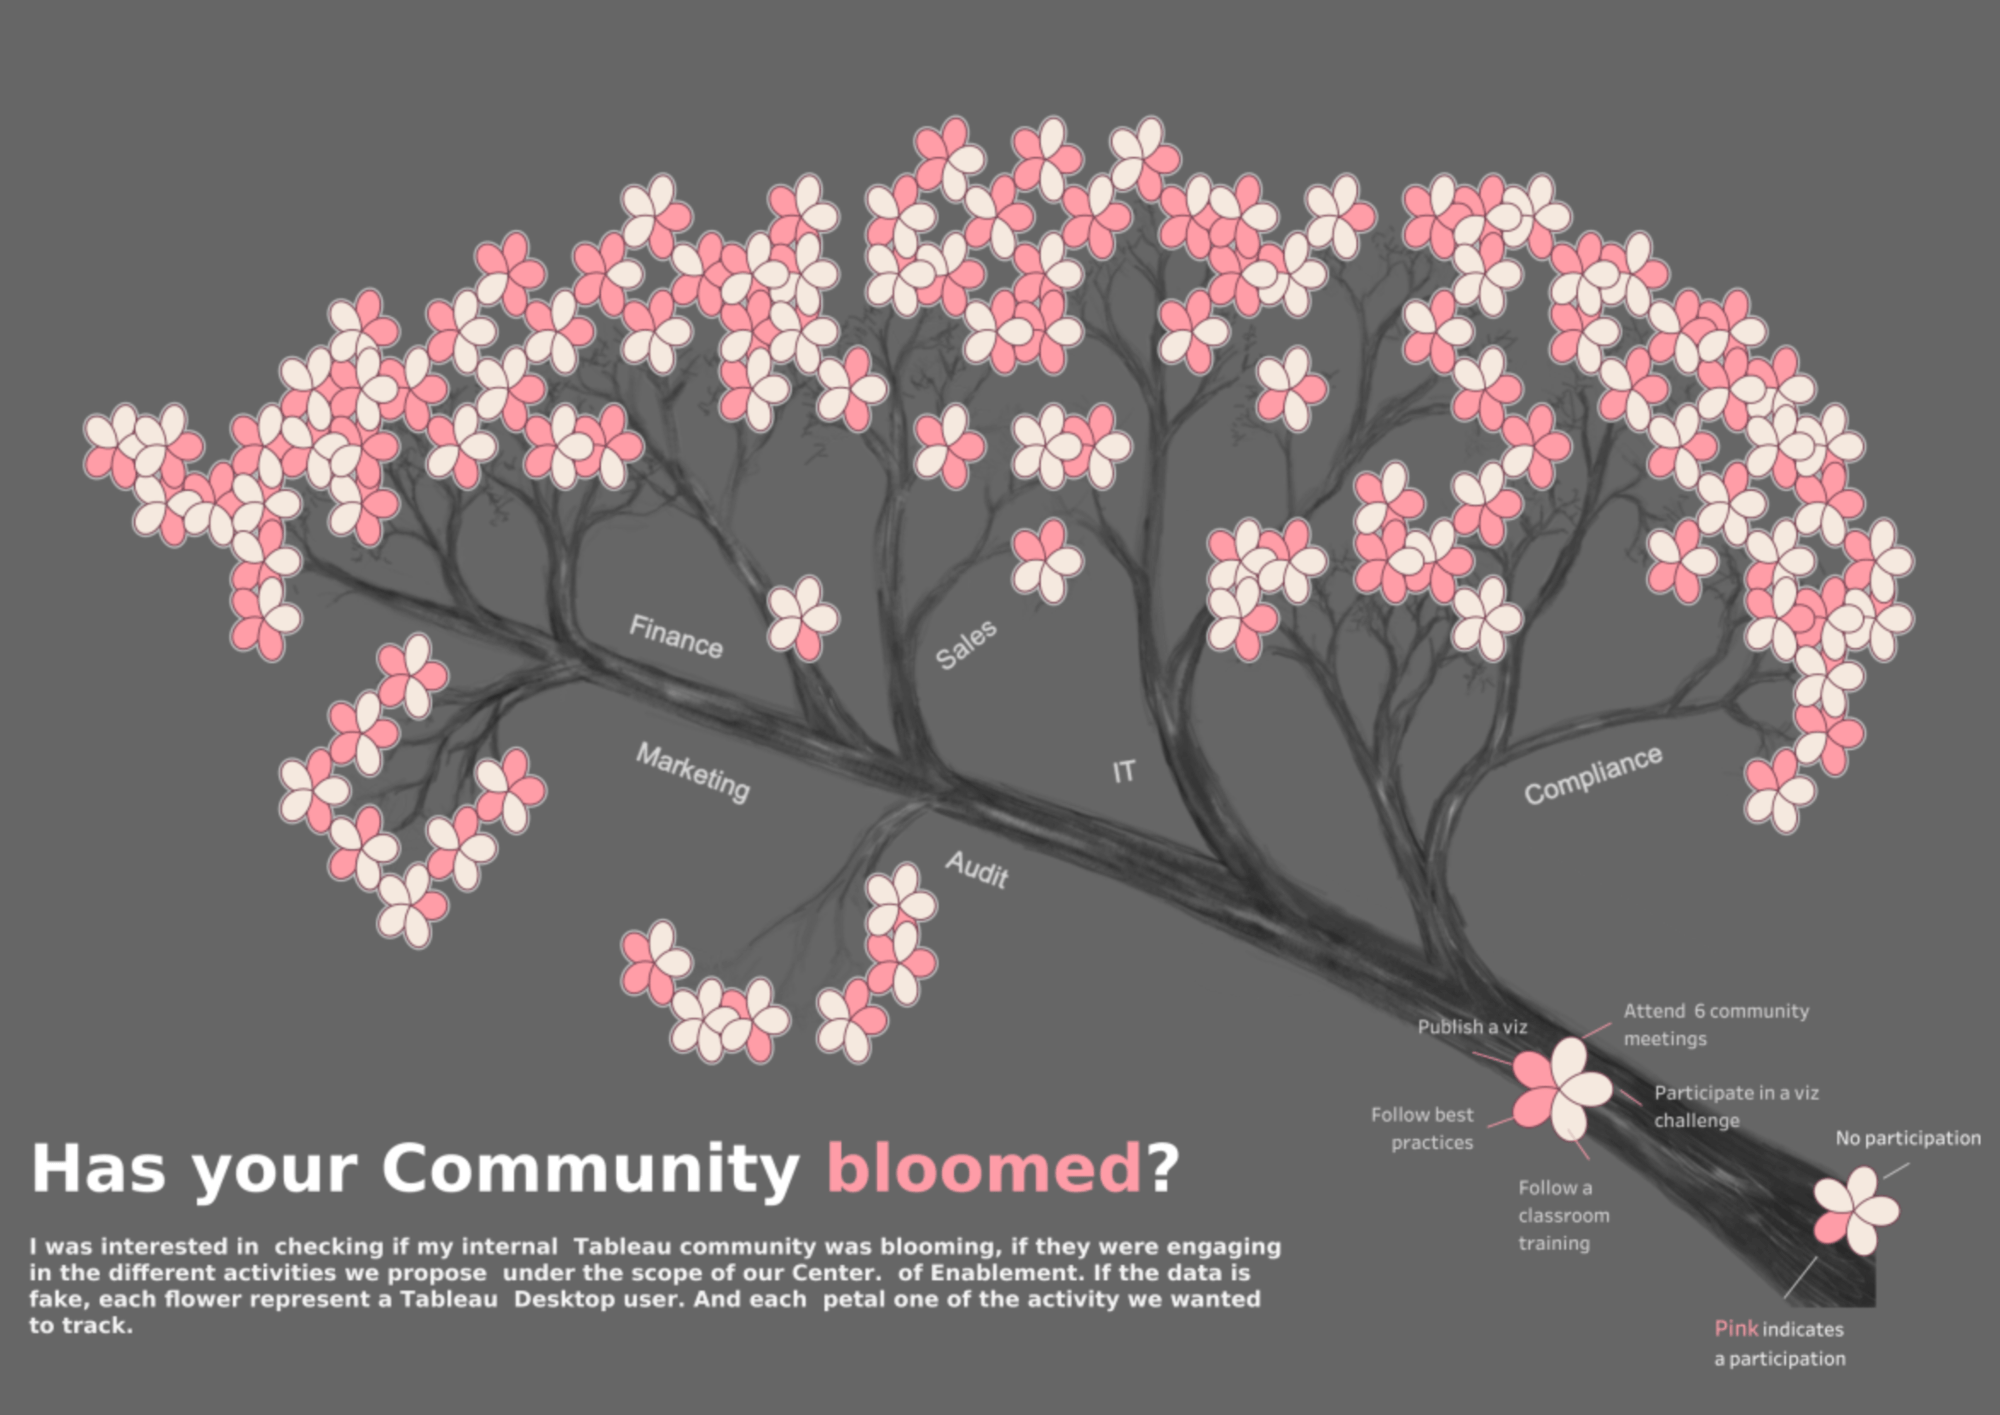
Annabelle Rincon, Rativiz: Is your community blooming
-
Gurpreet Singh, Data Viz Canvas: How to create Drop Shadow in Tableau
-
Andy Kriebel: VizWiz: How to Use ANY Tableau Public Dashboard as a Template for FREE!
-
Deepak Holla:
-
VU Analytics: Automate Tableau Tasks with vvtableau
Team Tableau
Upcoming events and community participation
-
Let’s Talk: AI Webinar Series Launch with Leah McGowen-Hare - 8/16 at 11am PDT Join us for the inaugural episode of Let’s Talk: AI webinar series hosted by Leah McGowen-Hare, SVP of Trailblazer Community. She will be joined by Paula Goldman, EVP, Chief Ethical & Humane Use Officer at Salesforce for a conversation on AI ethics and responsible use. Through fireside chats with thought leaders, this exciting new series aims to inspire curiosity, creativity, and critical thinking about AI’s potential. Come along as we embark on this transformative tech journey together!
-
Tableau Buddy for students and data aspirants (FREE) with Prasann Prem
-
Viz Collab is back: Hello everyone! I’m excited to be opening #VizCollab back up for another round of matches! In the last year I matched around 40 people for some amazing vizzes, including Viz of the Days and a viz that was featured in a local publication. So if you want to find a collaboration partner sign up.
-
VizIt Sydney is happening October 31 - November 1! A Tableau Community Conference, by the Datafam for the Datafam. Sign up to be the first to know when registration opens and submit to be a speaker now
-
Michelle Frayman, Zak Geis and Nicole Klassen: Viz Feedback Office Hours
-
Data Book Club: This summer, the Data Book Club is reading Living in Data: A Citizen's Guide to a Better Information Future by Jer Thorp.
-
Community Calendar and Upcoming Events: stay up-to-date on the latest Women in Dataviz events and other data visualization-related events. If you'd like to submit an event to the calendar, please fill out this form.
Vizzes
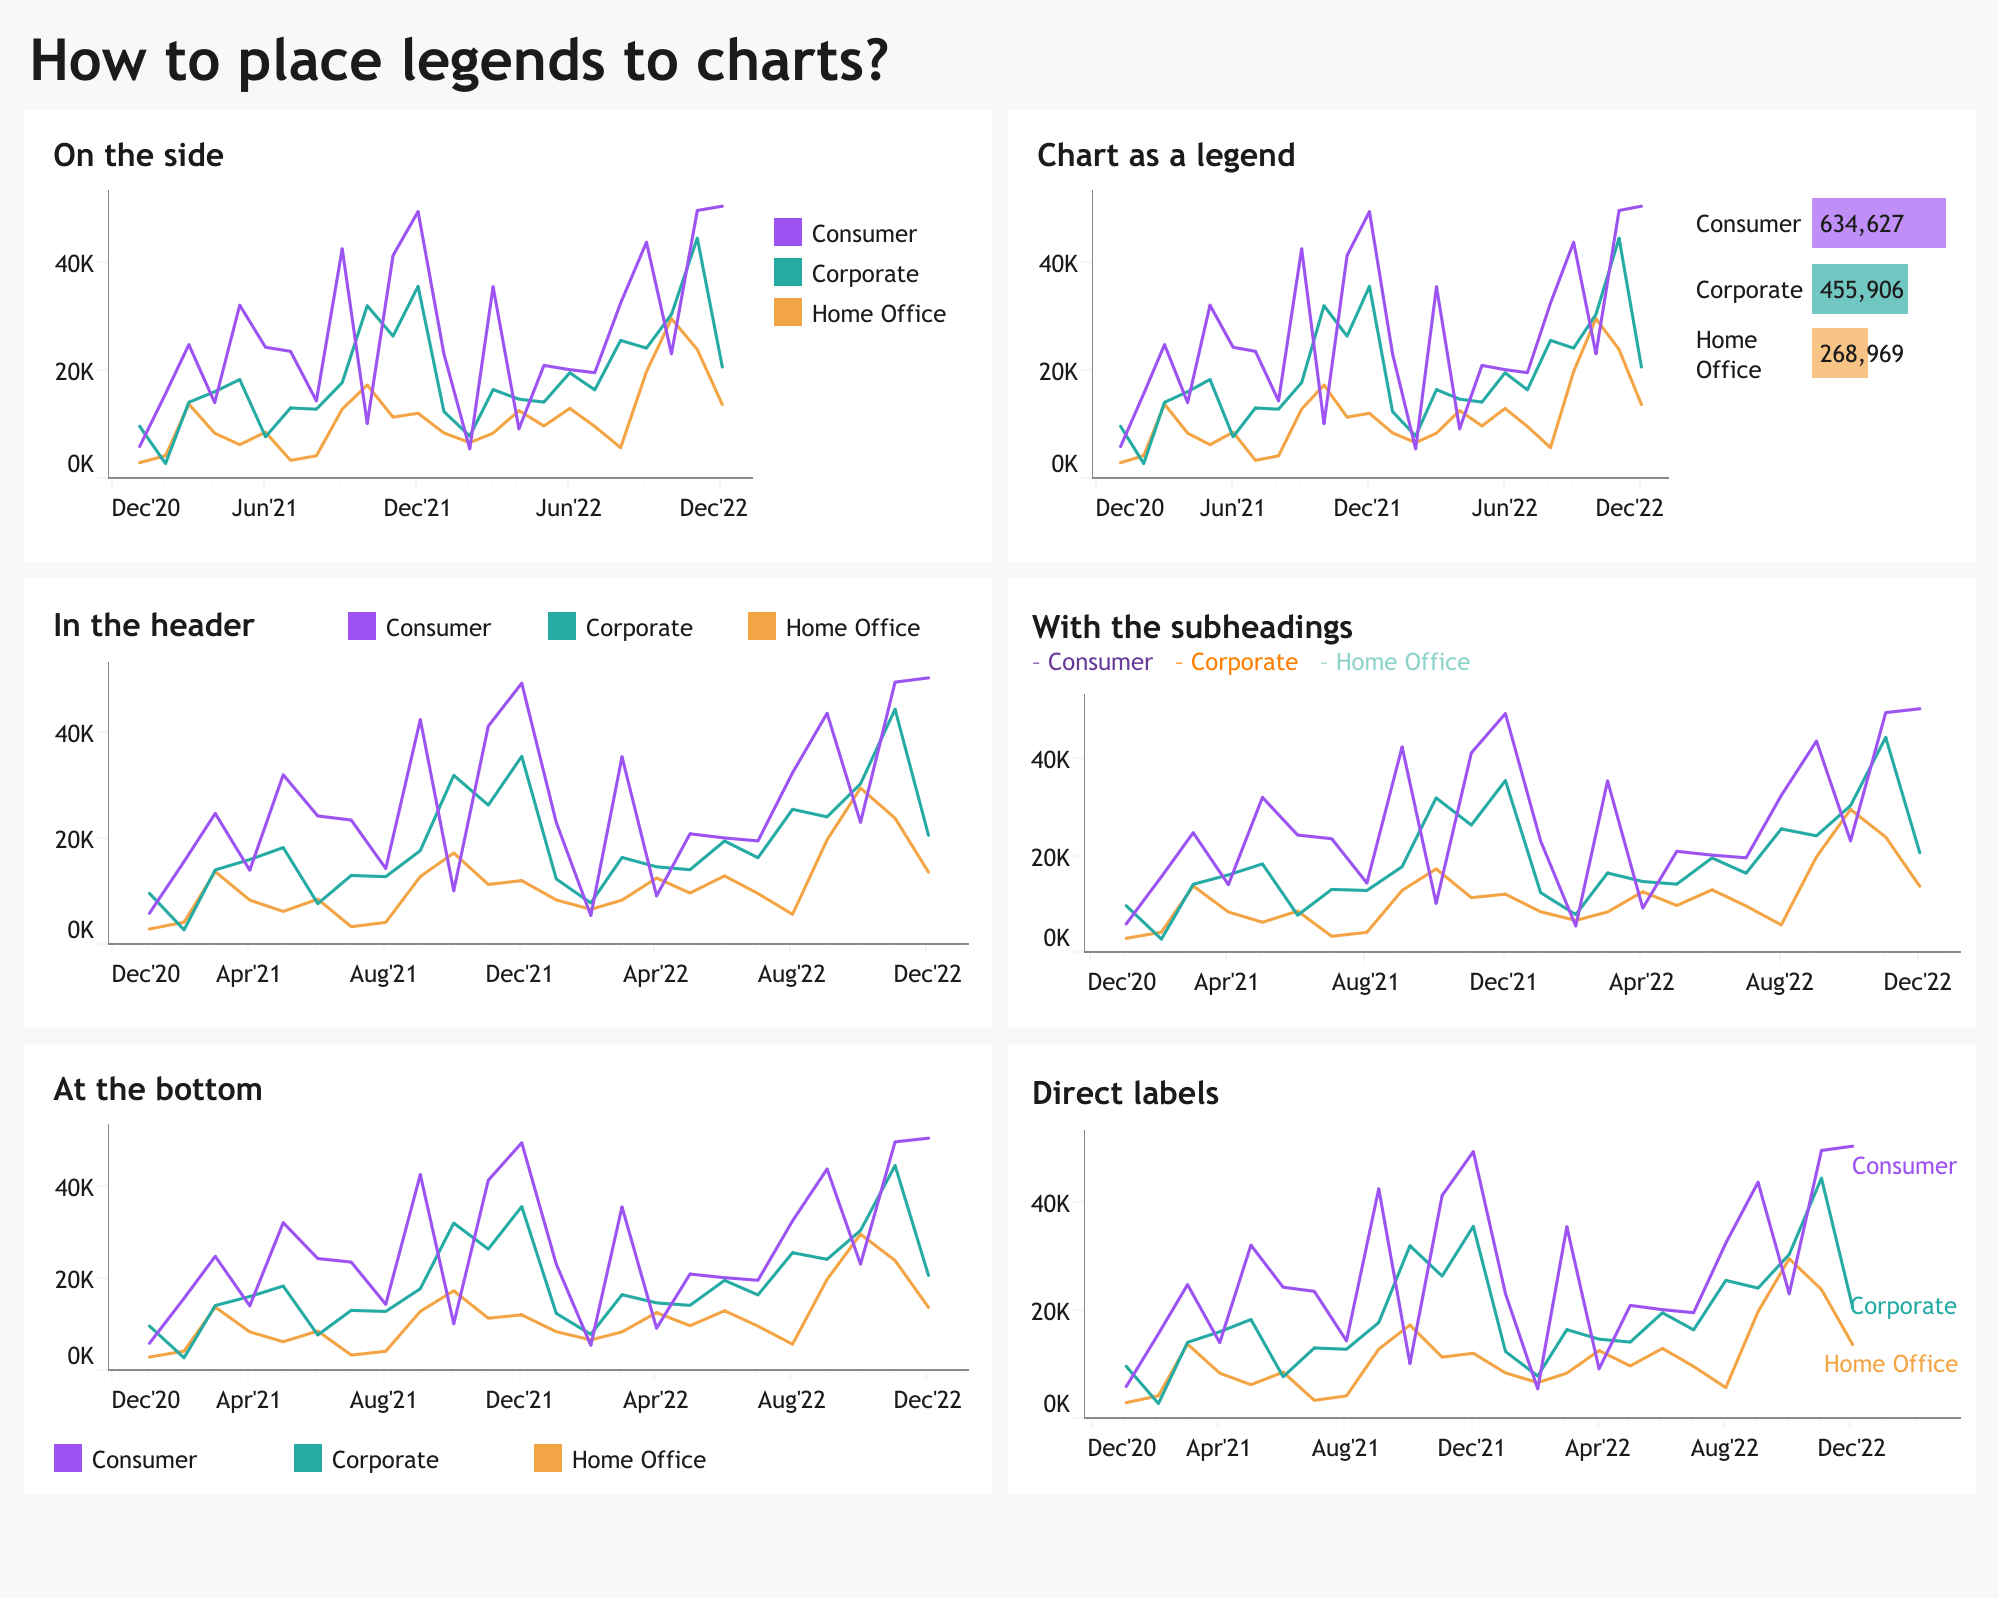
Anastasiia Kuznetsova: How to place legends to charts?
See the latest Viz of the Day, trending vizzes, featured authors, and more on Tableau Public.
Check out some inspirational vizzes created by the community:
-
Jim Dehner: Reference Lines and Bands
-
Satoshi Ganeko: My precious 500 Vizzes
-
Sam Epley:
-
Anastasiia Kuznetsova: How to place legends to charts?
-
Tamás Varga: Mavel - Parental Leave
-
tomoko: Calorie Check
Community Projects
Back 2 Viz Basics
A bi-weekly project helping those who are newer in the community and just starting out with Tableau. Not limited just to newbies!
Web: Back 2 Viz Basics
Twitter: #B2VB
Week 15: Dynamic Formatting
Workout Wednesday
Build your skills with a weekly challenge to re-create an interactive data visualization.
Web: Workout Wednesday
Twitter: #WOW2022
Week 32: Can you show all values when filtering?
Makeover Monday
A weekly social data project.
Web: Makeover Monday
Twitter: #MakeoverMonday
Week 32: Maven Family Leave Challenge
Preppin' Data
A weekly challenge to help you learn to prepare data and use Tableau Prep.
Web: Preppin’ Data
Twitter: #PreppinData
Week 32: HR Month - Reshaping Generations
DataFam Con
A monthly challenge covering pop culture and fandoms.
Web: DataFam Con
Twitter: #DataFamCon
April 2023: Kids Month!
EduVizzers
A monthly project connecting real education data with real people.
Web: Eduvizzers
August 2023: Data Analytics Programs in the U.S.
Games Night Viz
A monthly project focusing on using data from your favorite games.
Web: Games Nights Viz
Twitter: #GamesNightViz
Season 2: Exploding Hungry Pie-Charts
Iron Quest
Practice data sourcing, preparation, and visualization skills in a themed monthly challenge.
Web: Iron Quest
Twitter: #IronQuest
Advanced Chart Types
Storytelling with Data
Practice data visualization and storytelling skills by participating in monthly challenges and exercises.
Web: Storytelling with Data
Twitter: #SWDChallenge
August 2023: what does your audience know?
Project Health Viz
Uncover new stories by visualizing healthcare data sets provided each month.
Web: Project Health Viz
Twitter: #ProjectHealthViz
June 2023: Funding for Research for Various Conditions and Diseases
Diversity in Data
An initiative centered around diversity, equity & awareness by visualizing provided datasets each month.
Web: Diversity in Data
Twitter: #DiversityinData
May 2023: Mental Health Awareness Month and LGBTQ+ Representation in film
Sports Viz Sunday
Create and share data visualizations using rich, sports-themed data sets in a monthly challenge.
Web: Sports Viz Sunday
Twitter: #SportsVizSunday
January 2023: Is it a Sport or a Game?
Viz for Social Good
Volunteer to design data visualizations that help nonprofits harness the power of data for social change.
Web: Viz for Social Good
Twitter: #VizforSocialGood
June 9 - July 18, 2023: Gord Downie & Chanie Wenjack Fund
Real World Fake Data
Create business dashboards using provided data sets for various industries and departments.
Web: Real World Fake Data
Twitter: #RWFD
Session 5: Diversity Score Card
Data Plus Music
A monthly project visualizing the data behind the music we love!
Web: Data Plus Music
Twitter: #DataPlusMusic
Autres sujets pertinents

DataFam Roundup June 2026

DataFam Roundup May 2026

Iron Viz 2026: Read Between the Data
 28 Mai, 2026