DataFam Roundup: August 28–September 1, 2023


Welcome! Dig into this week's DataFam Roundup—a weekly blog that brings together community content all in one post. As always, we invite you to send us your content—and the DataFam content from your peers that have inspired you! Find the content submission form here.
Community Highlight
To recognize new and consistent Tableau contributors—we’re excited to have a section within the weekly DataFam Roundup called the Tableau Community Highlight. Find out how to get involved.

Ann Pregler
Washington, USA
Ann Pregler is a Tableau Developer professionally and enjoys creating fun, interactive visualizations that help make data easier to understand in her free time. Ann, a former teacher, combined her love of statistics and data, and her desire to do more with visual and programming components to change course into the world of data analytics in 2022. Through a Master’s in Data Analytics program, she attended a brief one-day session on Tableau–and it was enough to peak her interest. Ann now shares her knowledge through her blog and by participating in community projects such as Makeover Monday, Eduvizzers, and Iron Quest.
On her blog, Ann covers concepts not generally included in introductory Tableau courses, but sticks with techniques that can be used in everyday dashboards and visualizations. Because she relied on the many community resources available to level up her own skills, Ann hopes to use her blog as a way to pay it forward.
Connect with Ann on Linkedin, X, Tableau Public, and on her blog.
DataFam content
Dive into content created by the Tableau Community:
-
Margaret Awojide: A Comprehensive Guide to Combining Data in Tableau
-
Louis Yu: GNV Live Builds with Louis Yu | Pac-ful of characters
-
Will Sutton:
-
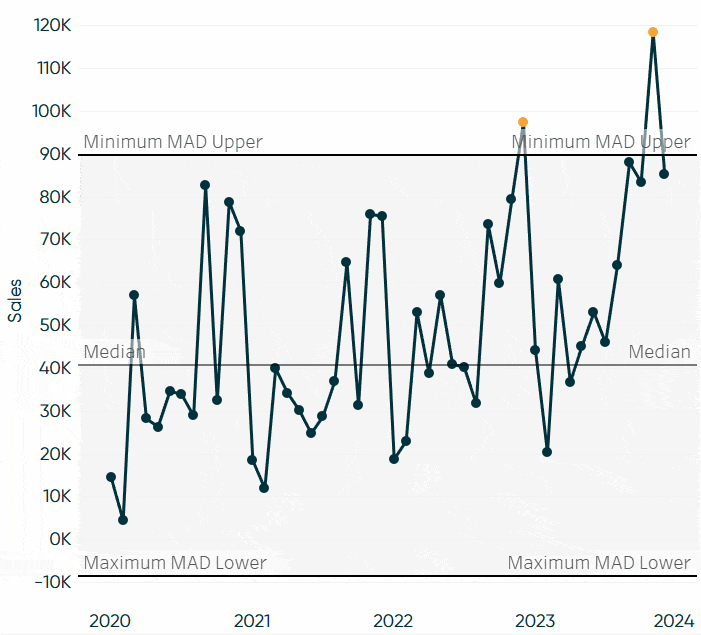
Ethan Lang, Playfair Data: Statistical Tableau: Using MAD to Detect Outliers in Non-Normalized Data | Playfair+
-
Dawn Harrington, TechTipsGirl: Separate Reference Lines for Each Pane
Upcoming events and community participation
-
Demystifying the way to learn Data Visualization! Are you looking for a way to learn Data Visualization and feeling lost? We all have been there and I am going to help you understand the fundamentals and look for a way to learn data visualization.
-
Career Pathmakers: This is the launch event for the Career PathMakers user group. This group will be focused on helping its members navigate challenges in their careers, both with a mentorship program and a transition support program.
-
Tableau Buddy for students and data aspirants (FREE) with Prasann Prem
-
Viz Collab is back: Hello everyone! I’m excited to be opening #VizCollab back up for another round of matches! In the last year I matched around 40 people for some amazing vizzes, including Viz of the Days and a viz that was featured in a local publication. So if you want to find a collaboration partner sign up.
-
VizIt Sydney is happening October 31 - November 1! A Tableau Community Conference, by the Datafam for the Datafam. Sign up to be the first to know when registration opens and submit to be a speaker now
-
Michelle Frayman, Zak Geis and Nicole Klassen: Viz Feedback Office Hours
-
Data Book Club: This summer, the Data Book Club is reading Living in Data: A Citizen's Guide to a Better Information Future by Jer Thorp.
-
Community Calendar and Upcoming Events: stay up-to-date on the latest Women in Dataviz events and other data visualization-related events. If you'd like to submit an event to the calendar, please fill out this form.
Vizzes
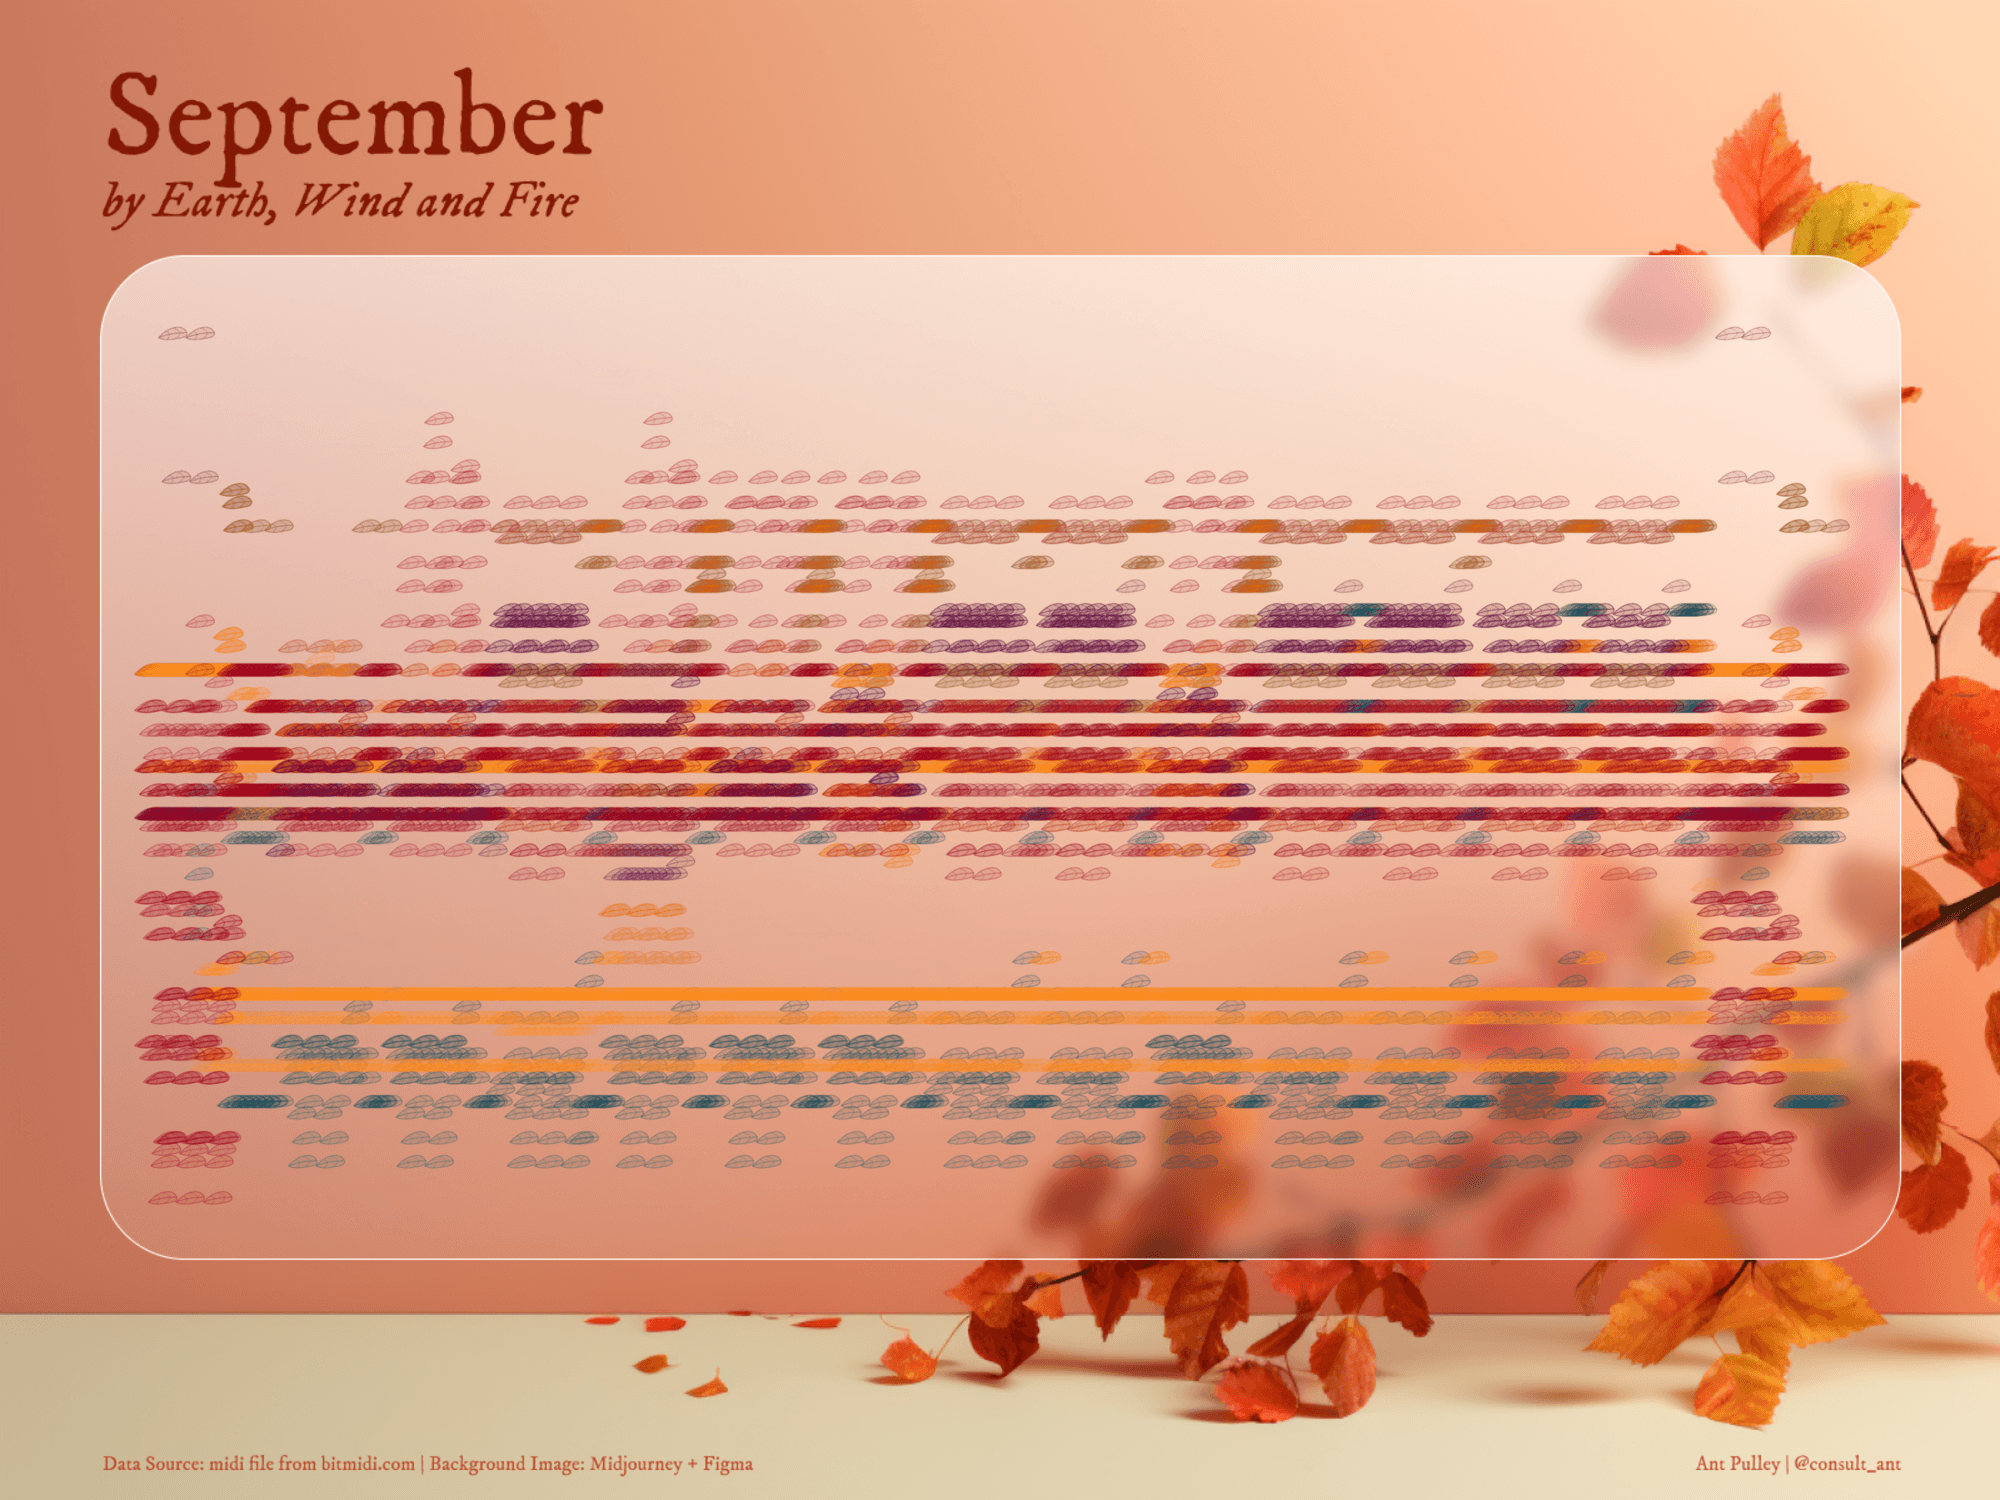
Ant Pulley: September
See the latest Viz of the Day, trending vizzes, featured authors, and more on Tableau Public.
Check out some inspirational vizzes created by the community:
-
Mattias Giger: Resolved Issues Tableau Desktop, Prep and Server
-
Anastasiia Kuznetsova: Countries Passport Index
-
Ant Pulley: September
-
Srividhya Ranganathan: It's Taylor Swift's World!
-
Shreya Arya: Fancy going out for a drink? | Makeover Monday
Community Projects
Back 2 Viz Basics
A bi-weekly project helping those who are newer in the community and just starting out with Tableau. Not limited just to newbies!
Web: Back 2 Viz Basics
Twitter: #B2VB
Week 17: Design a Wireframe
Workout Wednesday
Build your skills with a weekly challenge to re-create an interactive data visualization.
Web: Workout Wednesday
Twitter: #WOW2022
Week 35: Can you build an interactive Viz in Tooltip?
Makeover Monday
A weekly social data project.
Web: Makeover Monday
Twitter: #MakeoverMonday
Week 35: Food Inflation Rates in the UK
Preppin' Data
A weekly challenge to help you learn to prepare data and use Tableau Prep.
Web: Preppin’ Data
Twitter: #PreppinData
Week 35: HR Month - Transfers
DataFam Con
A monthly challenge covering pop culture and fandoms.
Web: DataFam Con
Twitter: #DataFamCon
September 2023: Barbie World!
EduVizzers
A monthly project connecting real education data with real people.
Web: Eduvizzers
September 2023: School Book Bans in the United States
Games Night Viz
A monthly project focusing on using data from your favorite games.
Web: Games Nights Viz
Twitter: #GamesNightViz
Season 2: Battle of the Strongest
Iron Quest
Practice data sourcing, preparation, and visualization skills in a themed monthly challenge.
Web: Iron Quest
Twitter: #IronQuest
Advanced Chart Types
Storytelling with Data
Practice data visualization and storytelling skills by participating in monthly challenges and exercises.
Web: Storytelling with Data
Twitter: #SWDChallenge
August 2023: what does your audience know?
Project Health Viz
Uncover new stories by visualizing healthcare data sets provided each month.
Web: Project Health Viz
Twitter: #ProjectHealthViz
June 2023: Funding for Research for Various Conditions and Diseases
Diversity in Data
An initiative centered around diversity, equity & awareness by visualizing provided datasets each month.
Web: Diversity in Data
Twitter: #DiversityinData
May 2023: Mental Health Awareness Month and LGBTQ+ Representation in film
Sports Viz Sunday
Create and share data visualizations using rich, sports-themed data sets in a monthly challenge.
Web: Sports Viz Sunday
Twitter: #SportsVizSunday
January 2023: Is it a Sport or a Game?
Viz for Social Good
Volunteer to design data visualizations that help nonprofits harness the power of data for social change.
Web: Viz for Social Good
Twitter: #VizforSocialGood
June 9 - July 18, 2023: Gord Downie & Chanie Wenjack Fund
Real World Fake Data
Create business dashboards using provided data sets for various industries and departments.
Web: Real World Fake Data
Twitter: #RWFD
Session 5: Diversity Score Card
Data Plus Music
A monthly project visualizing the data behind the music we love!
Web: Data Plus Music
Twitter: #DataPlusMusic
Autres sujets pertinents

DataFam Roundup June 2026

DataFam Roundup May 2026

Iron Viz 2026: Read Between the Data
 28 Mai, 2026