
Hyundai Glovis' Data Journey with Tableau
Transforming an Inefficient Meeting Culture to Real-Time Data-Driven Decision Making
Achieving True Data Democratization with Over 250 Self-Service Reports
Building a Data Service to Integrate Global Logistics Metrics
Hyundai Glovis has overcome the inefficiencies of a meeting culture and a data management system centered on individual manual work by establishing a field-led data analysis platform called VODA (Visibility On Data Analysis) through Tableau. Under the philosophy that "data must be shown to solve problems," they have innovated their data culture organization-wide, achieving practical outcomes such as reducing meeting preparation time and enabling real-time data-driven decision making. Here’s Hyundai Glovis' data journey.
About the Company
Hyundai Glovis is a logistics company headquartered in Seoul, South Korea and part of the Hyundai Motor Group. It defines itself as a "company of connections." As a Global Smart Supply Chain Management (SCM) Provider, they connect value and services across various business areas, from finished vehicle transportation and parts logistics to steel logistics, shipping, KD business, export-import air transport, used car auctions, and resource trading, spanning land, sea, and sky.
The term "connection" at Hyundai Glovis has a special meaning. Every connection has an end, which they call "completion." Their mission is not only to connect well but also to complete well. This concept of connection and completion includes data.
The Challenge
The Limitations of Data Management in the Growth Process
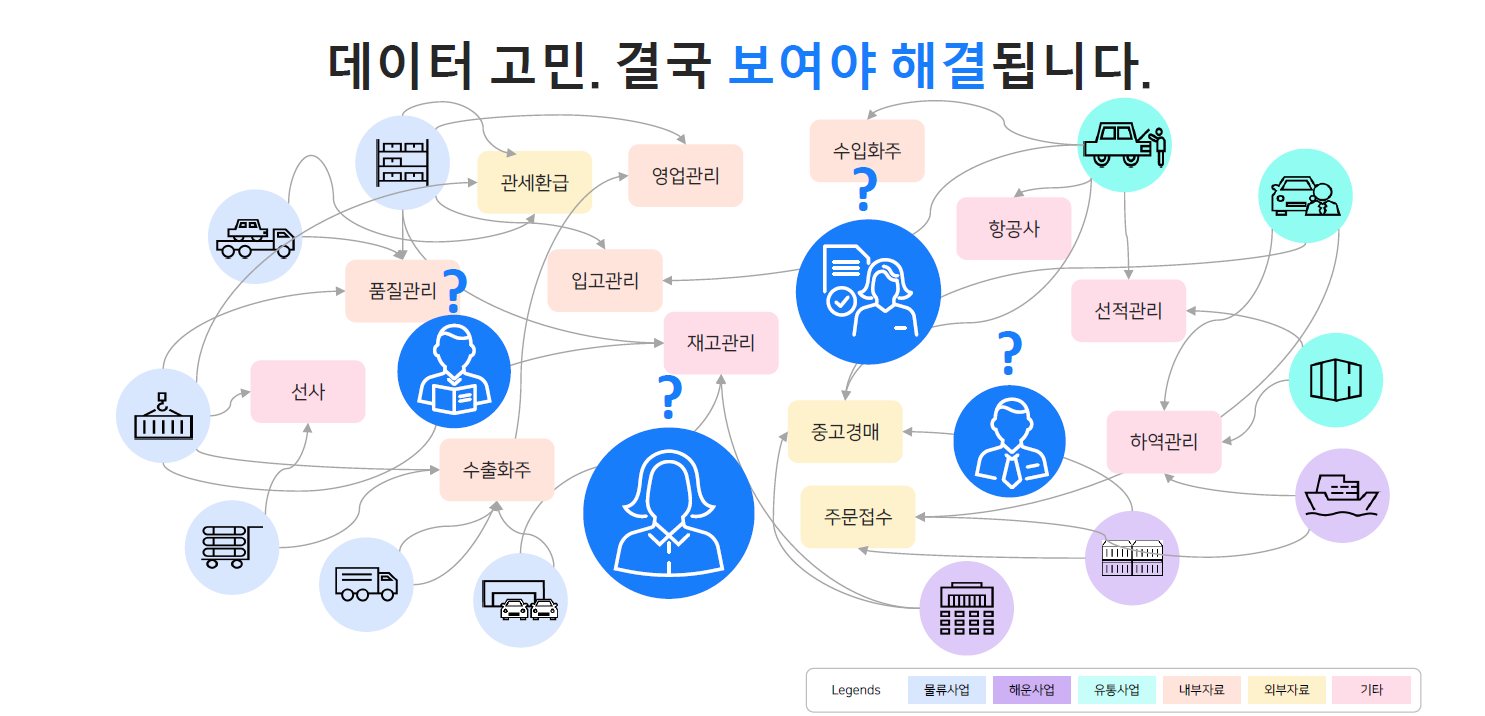
The background for Hyundai Glovis' data innovation lies in long-standing structural issues. While they had systems and data, problems often arose at the end of the process because it ultimately depended on human handling. Claims like "the numbers are wrong" or "the data doesn't match" required the data to be repeatedly corrected and re-verified.
Preparing for meetings was even more complex. When a meeting facilitator was assigned, they would start gathering data from various sources based on personal expertise. Even after diligently compiling the data into meeting documents, the process wasn't over. Managers had to review and approve the data, making the entire endeavor resource-intensive and stressful.
The Field's Perspective: "Show the Data to Solve the Problem"
The Digital Engineering Team at Hyundai Glovis gained a crucial insight while continuously working on data tasks. They realized that the field's actual needs were different from what many companies focus on.
Field employees are not interested in grand data pipelines, optimization, or the latest big data technologies. What matters to them is whether they can use the data they need when they need it.
From this field perspective, the key was methodology, process, and policy. They concluded that "how to approach it" was more important than "what to use." Additionally, they emphasized that "no matter how excellent the system and data are, they must be visible" to identify and solve problems.
The Birth of VODA: A Project for Visible Data
To address these issues, Hyundai Glovis formulated a comprehensive strategy to enhance their data analysis environment. This was not just about changing tools but about systematizing the entire approach.
They adopted data virtualization to distribute data quickly and efficiently, chose Tableau Server as their visualization solution, and built VODA, a data analysis portal. They also worked on fostering a culture to support all these initiatives.
Among these, Tableau was the most critical. Hyundai Glovis had previously used other BI solutions but failed to implement them successfully. Upon reflection, the problem was in the training and support. To spread Self-Service BI, they needed robust training support, rich learning content, and a strong community, areas where Tableau excelled.
Moreover, many experienced users from research institutes, schools, and companies were already familiar with Tableau, which was advantageous for strategic collaboration and talent acquisition. For these reasons, they chose Tableau, and the results have been highly successful.
Why Tableau: A User-Centric Platform with Excellent Training and Support
- Diverse Free Training Programs and Development Systems
- Rapid Support Requests and Responses Based on Demand
- A Solid User Base (Widely Used in Schools and Companies)
- Abundant Skilled Users → Flexible Service Strategy Development
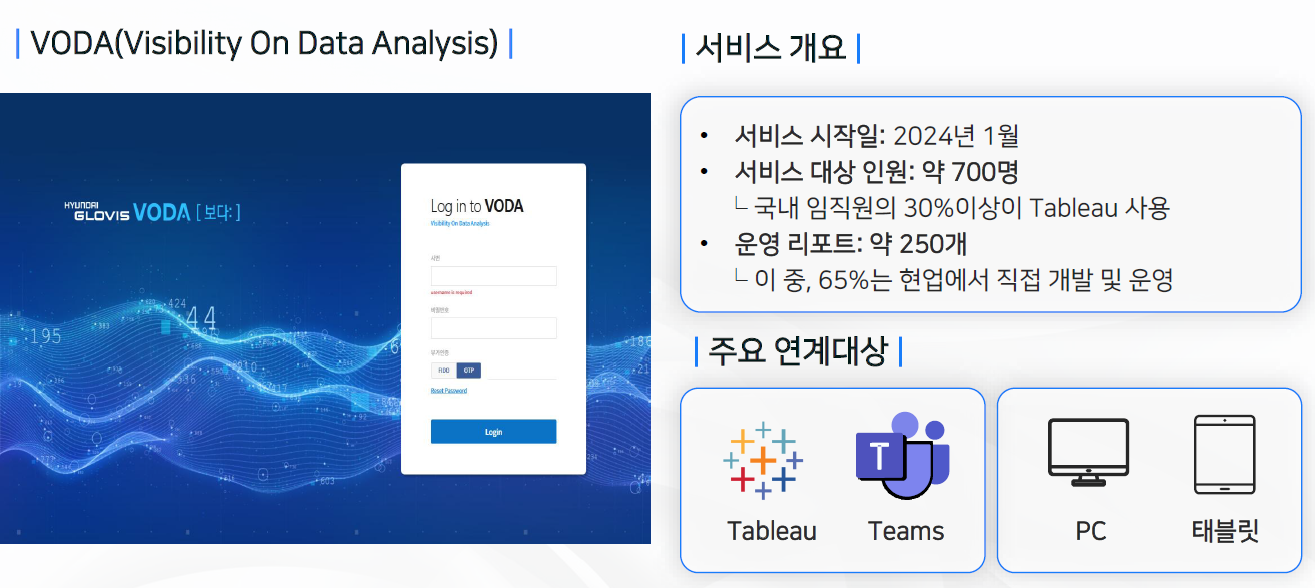
The outcome of this process is VODA, Hyundai Glovis' data analysis platform centered around Tableau. VODA stands for Visibility On Data Analysis, embodying the idea of "seeing phenomena through data" or "seeing the truth through data."
VODA has been operational since January 2024 and has steadily grown. In Hyundai Glovis, which has slightly over 2,000 employees, more than 30% of the staff use VODA directly or indirectly for their work. VODA is integrated with Tableau, Microsoft Teams, PCs, and tablets, with the Teams integration significantly enhancing accessibility.
Technology is Secondary: People and Culture are Key
For a successful data culture, people and culture are more important than solutions or systems. Hyundai Glovis developed a systematic training strategy to achieve this.
First, they utilized Tableau's boot camp program but customized it for Hyundai Glovis employees. By tailoring the curriculum, operation methods, and platform to fit the employees' characteristics, they significantly improved participation and completion rates.
Furthermore, they collaborated with the HRD organization to incorporate Tableau training into the company's official Individual Development Plan (IDP). This strategic move transformed the training from a simple solution usage guide to an officially recognized and strategic educational program, greatly enhancing employees' motivation and engagement.
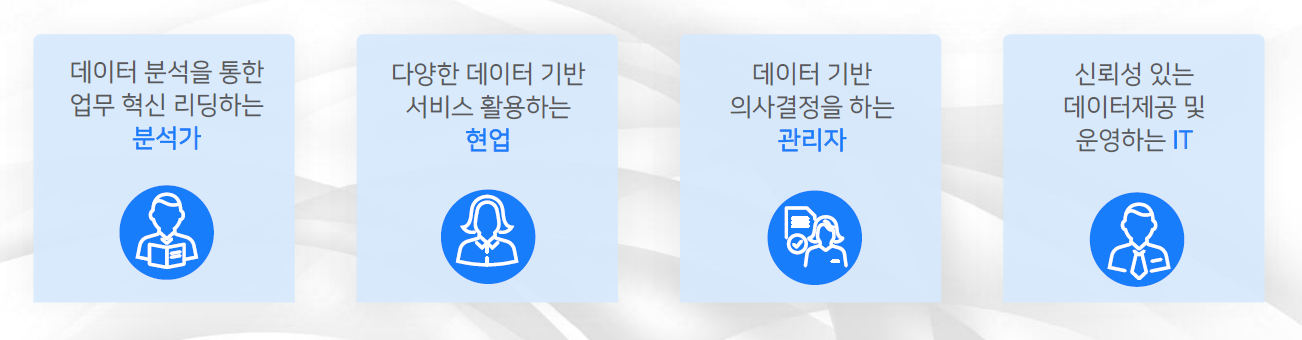
Through these activities, Hyundai Glovis has built a data-centric virtuous ecosystem. Data analysts derive more insights using Tableau, managers make real-time data-driven decisions, field employees grow into analysts by working with data, and the IT organization plays a planning role to oversee everything.
A Complete Transformation of the Meeting Room
The most significant change since the introduction of VODA has been the meeting culture. Previously, meetings required a complex process: assigning a facilitator, manually gathering data, creating documents, and getting them reviewed and approved. This process involved many people, resources, and efforts, causing considerable stress.
Now, meetings are conducted in a completely different way. There's no need to create separate documents; whether it's an executive or a junior employee, they can simply access VODA to view reports, completing the meeting preparation. The integration with Teams makes it even more convenient, allowing users to add comments, share opinions, and collaborate freely during meetings.
VODA can take full responsibility for the entire meeting process, from preparation to completion.
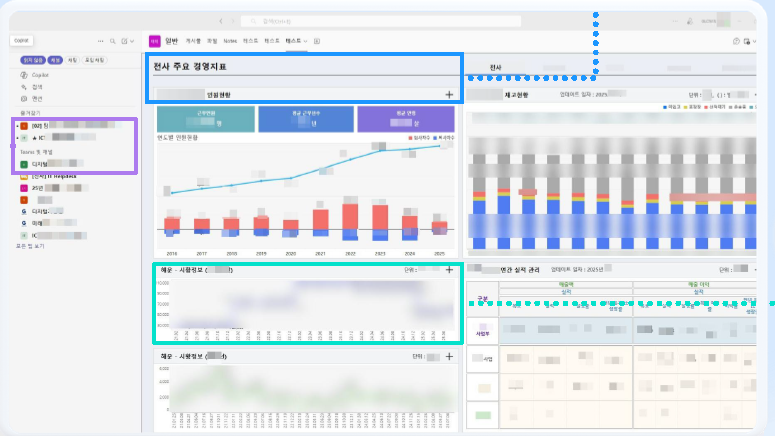
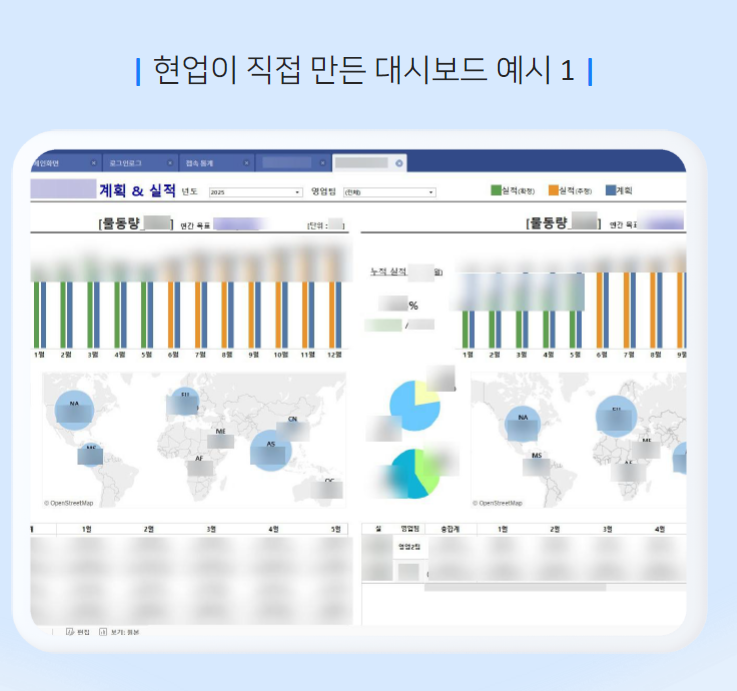
How Tableau Helps
Example of a Hyundai Glovis VODA Dashboard
The Spread of Field-Led Self-Service: A Major Achievement
One of the most notable achievements in Hyundai Glovis' data innovation is the spread of a field-led self-service culture. Over 250 reports are currently available on VODA, and more than half of these are created by field employees who connect and analyze their own data.
These reports are often simple, unpolished, and not sophisticated. However, Hyundai Glovis views this field-led self-service as true data democratization.
A single self-service BI report created and used by field employees is more valuable than 10 beautiful and elaborate reports made by professional developers.
Continuous Innovation: "Connecting Data to Complete Customer Satisfaction"
"Insights start with connections. To achieve this, Glovis is working on connecting both internal and external data."
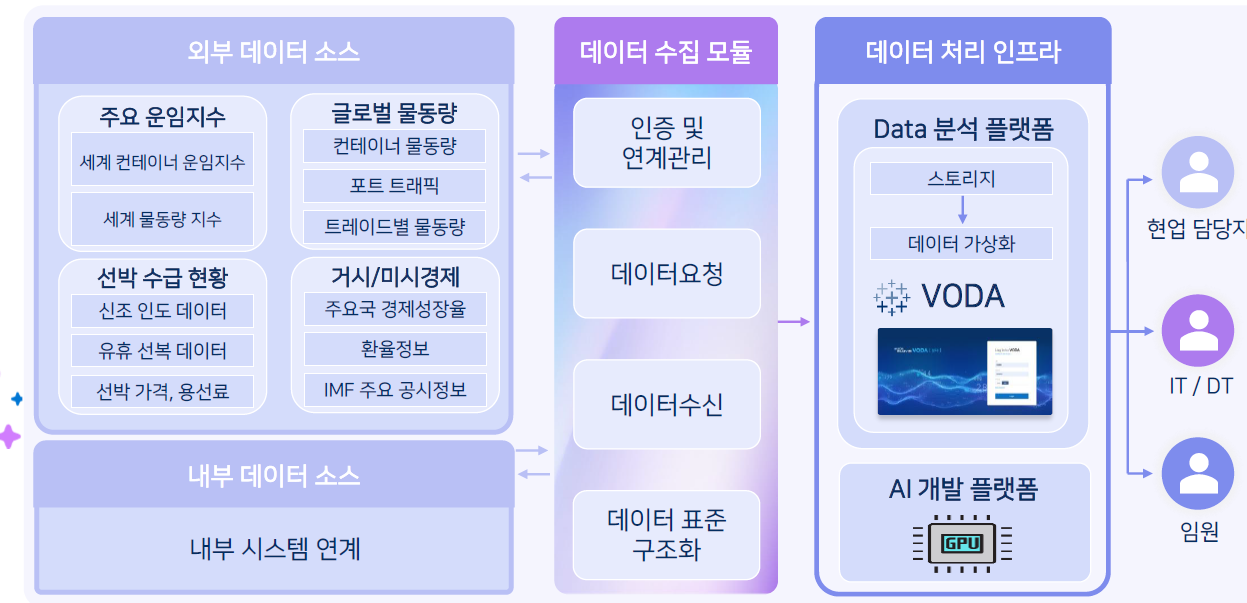
Hyundai Glovis is currently working on an external data assetization project. Given the sensitivity of the logistics industry to external market conditions and information, they have traditionally relied on individual expertise and ad-hoc responses. Now, they are building an integrated data service that allows all employees to utilize various external data, including key freight indices, global container freight indices, global logistics volumes, port traffic, ship supply and demand status, macro and microeconomic indicators, exchange rate information, and major IMF announcements.
[Hyundai Glovis external data assetization project]
The Tableau Difference
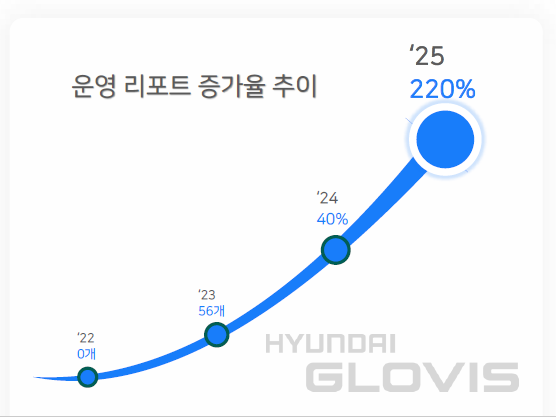
The Impact of Hyundai Glovis' Data Journey in Numbers
The numbers tell an impressive story of Hyundai Glovis' data journey. Starting with zero operational reports in 2022, they introduced Tableau in 2023 and created 56 reports. In 2024, this number increased by 40%, and by 2025, they expect a 220% increase, demonstrating explosive growth.
[Operation Report Growth Trends]
However, the most important achievement is not the numbers. The true success of Hyundai Glovis lies in their field-centric data culture. Field employees now create their own dashboards to access the data they need and use these to improve their work. In Glovis' meeting rooms, real-time data and objective facts have replaced thick reports and personal intuition.
Hyundai Glovis' slogan, "From Connection to Completion," is fully realized in the data domain. They not only connect data but also complete the process of practical business innovation through VODA. They will continue their journey of innovation, connecting data to complete customer satisfaction.