Seeing and understanding proximity made easy with buffer calculations


Distance is an important factor when analyzing geospatial data. In the newest version of Tableau 2020.1, visualizing and analyzing distances has improved dramatically with a new spatial calculation called buffer. Buffers are boundaries around a point, that can be used to spatially aggregate data. Most importantly, the Buffer function can be used in a spatial join, meaning you can now join two non-spatial data sources like Excel tables or csv files based on distance! This removes the need for complex workarounds and makes answering questions like, “How many competitive stores are within 1-mile of my store?” super simple.
In this post, I’ll compare and contrast the common ways that you can work with distances in Tableau today and use an example to showcase the power of buffer calculations.
3 easy ways to explore distance-driven analysis in Tableau
There are several ways to explore spatial relationships based on distances in Tableau.
- Radial select tool: If you want to interactively measure a distance on a map between two locations, or select marks that are within a certain distance, you can use the radial select tool. The radial selection is like a transient buffer–it draws a distance-based boundary around a starting point, but as soon as you complete your selection, the boundary disappears.
- Distance calculation: If you want to measure distances between pairs of locations, you can use the Distance function. The Distance function can measure distances in feet, meters, miles, or kilometers, and is straightforward to use when each row in your table includes the origin and destination latitudes and longitudes. With a few more steps, you can also use actions, parameters, and calculations to explore proximity in more flexible ways.
- Buffer calculations: In 2020.1, there is a new way to level-up your distance-driven analysis using buffers. Buffers are easy to create and make spatial analysis easier than ever when working with latitudes and longitudes. So what exactly does a buffer do? Buffers create a boundary around a point-location using a new spatial function. With this boundary, you can see your area of interest or use it to join another geospatial dataset together.
Using buffers to examine proximity between schools and stores with liquor licenses
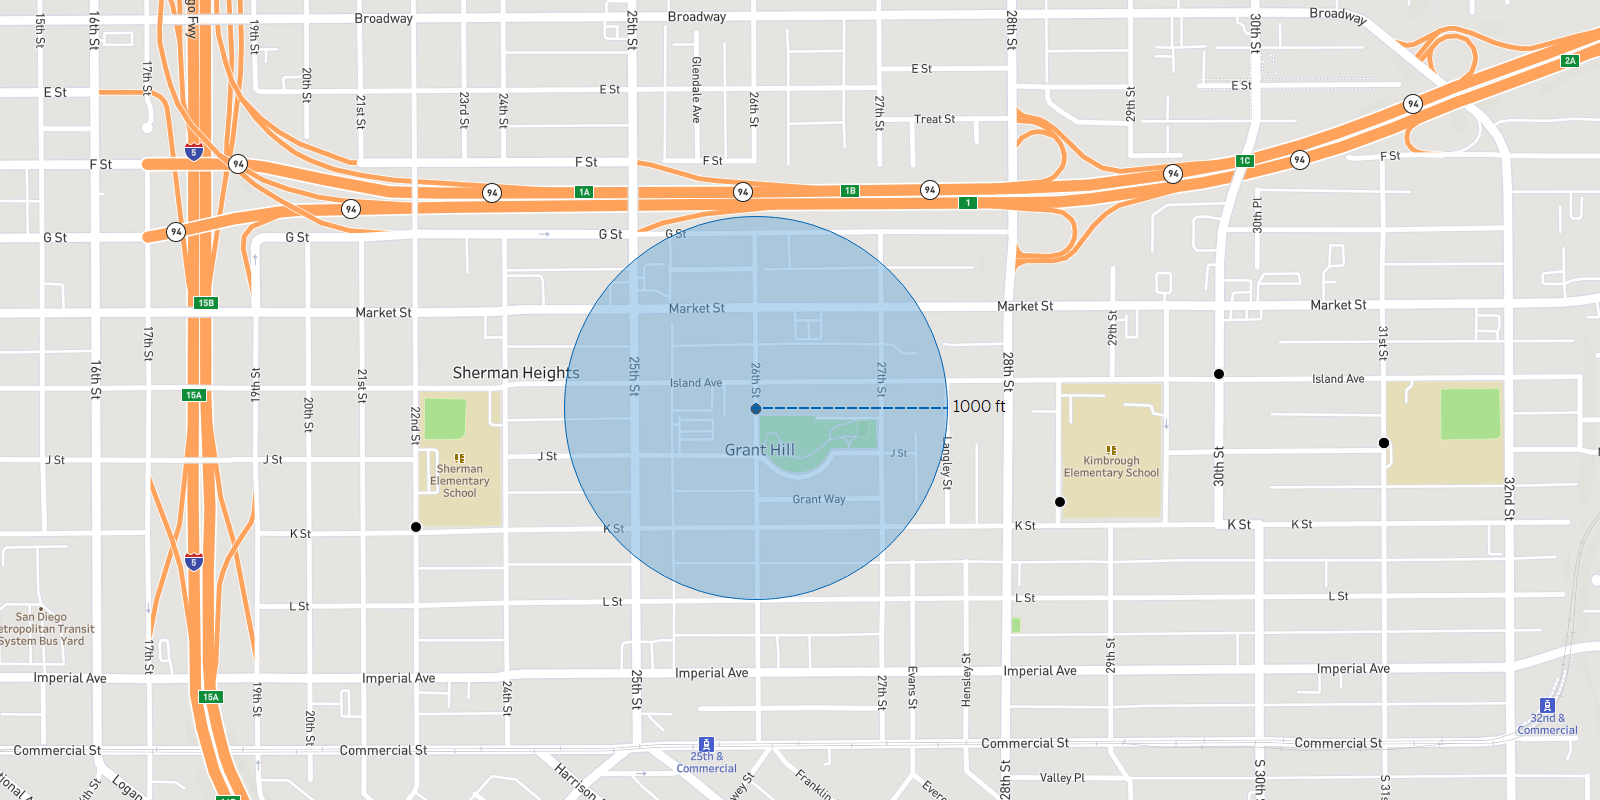
Let’s look at a real example where I want to visualize an 800-foot buffer around schools in San Diego, California.
The steps are simple.
- Create a new buffer calculation
- In the calculation, specify the location, the distance, and the units
- Drag the calculated field on to the viz

If you want the buffer to be a dynamic radius, no problem.
- In the buffer calculation, replace the distance with a parameter
- Show the parameter control
- As you adjust the parameter, the buffers will update on the map

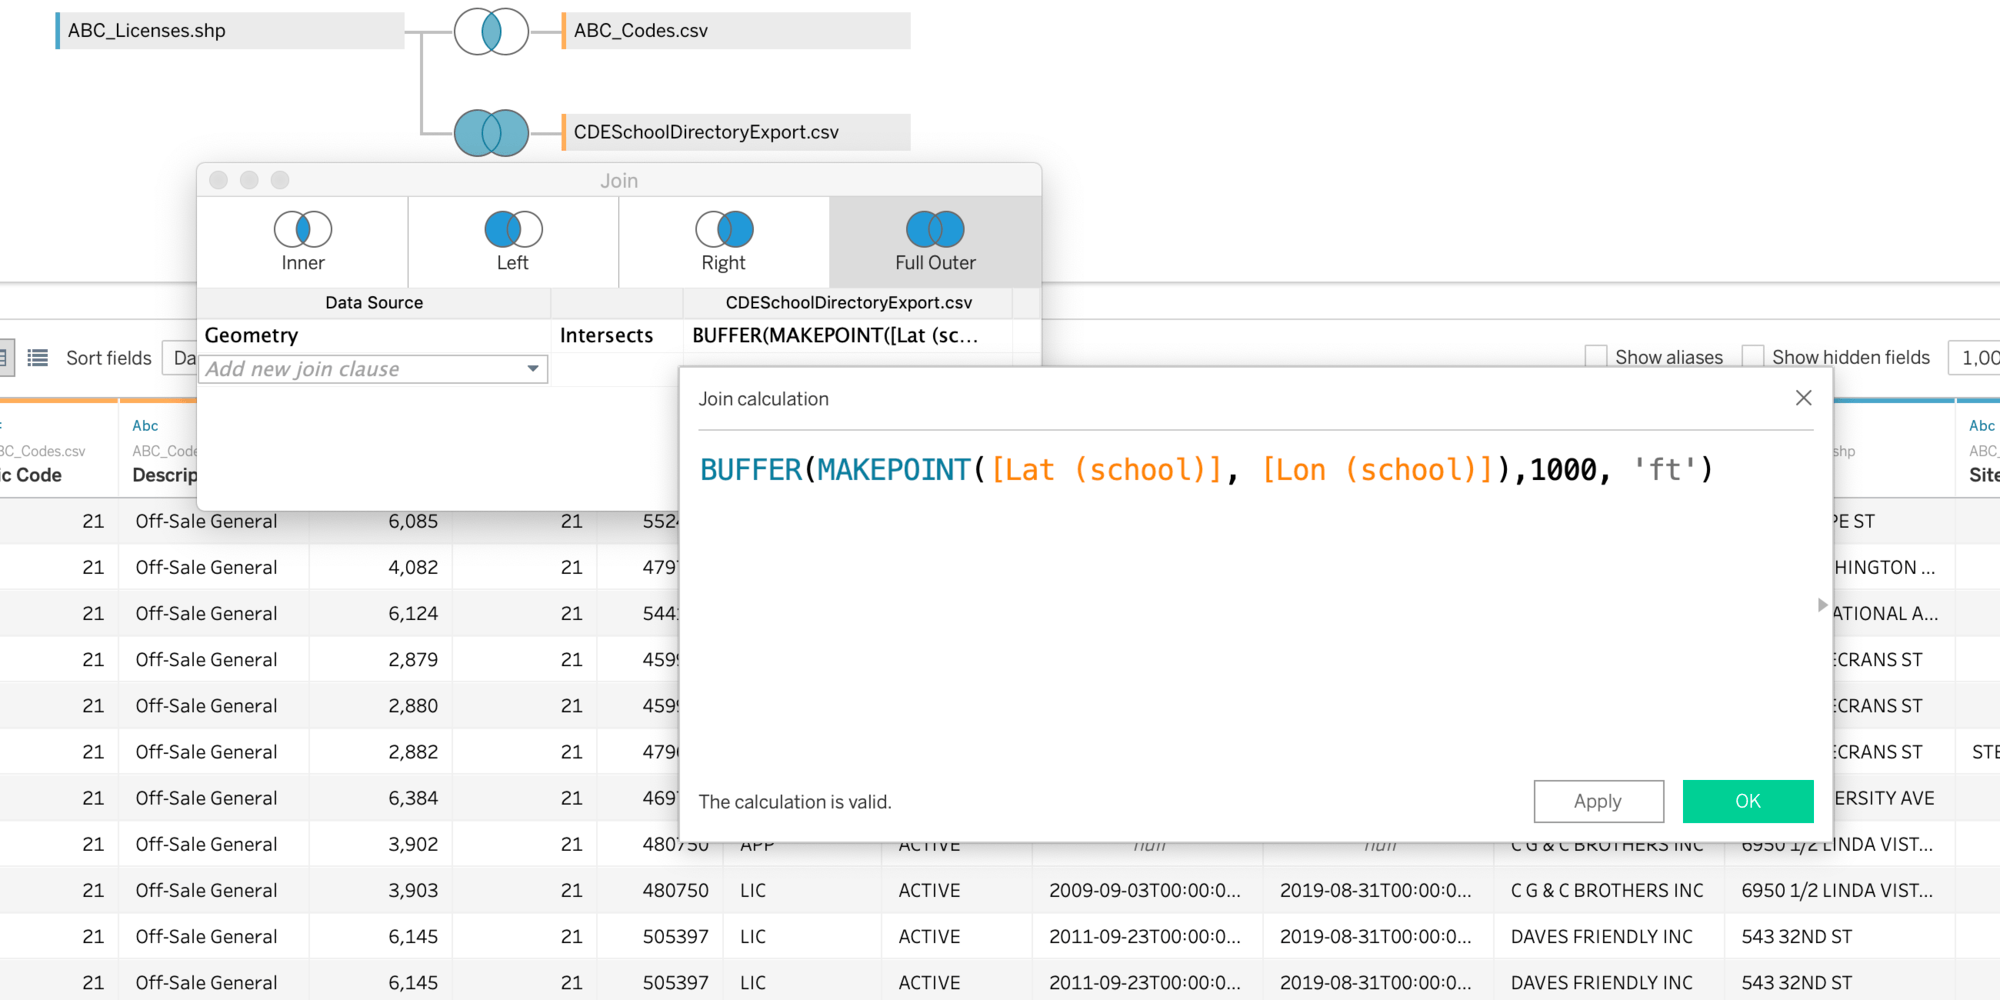
Let’s take this example one step further. I want to see and understand how many stores with liquor licenses are within 1000-feet of a school. I will need to combine the two datasets, stores, and schools using their location.
- On the Data Source tab, add the relevant tables
- To join by location, use a spatial field from both tables, which allows you to use Intersects
- In this case, Stores has a geometry field, but Schools have latitude and longitudes
- You can create a spatial boundary around the latitude and longitudes using the buffer function
- With a valid join, I can build a new worksheet
BUFFER(MAKEPOINT([Lat (school)], [Lon (school)]),1000, 'ft')
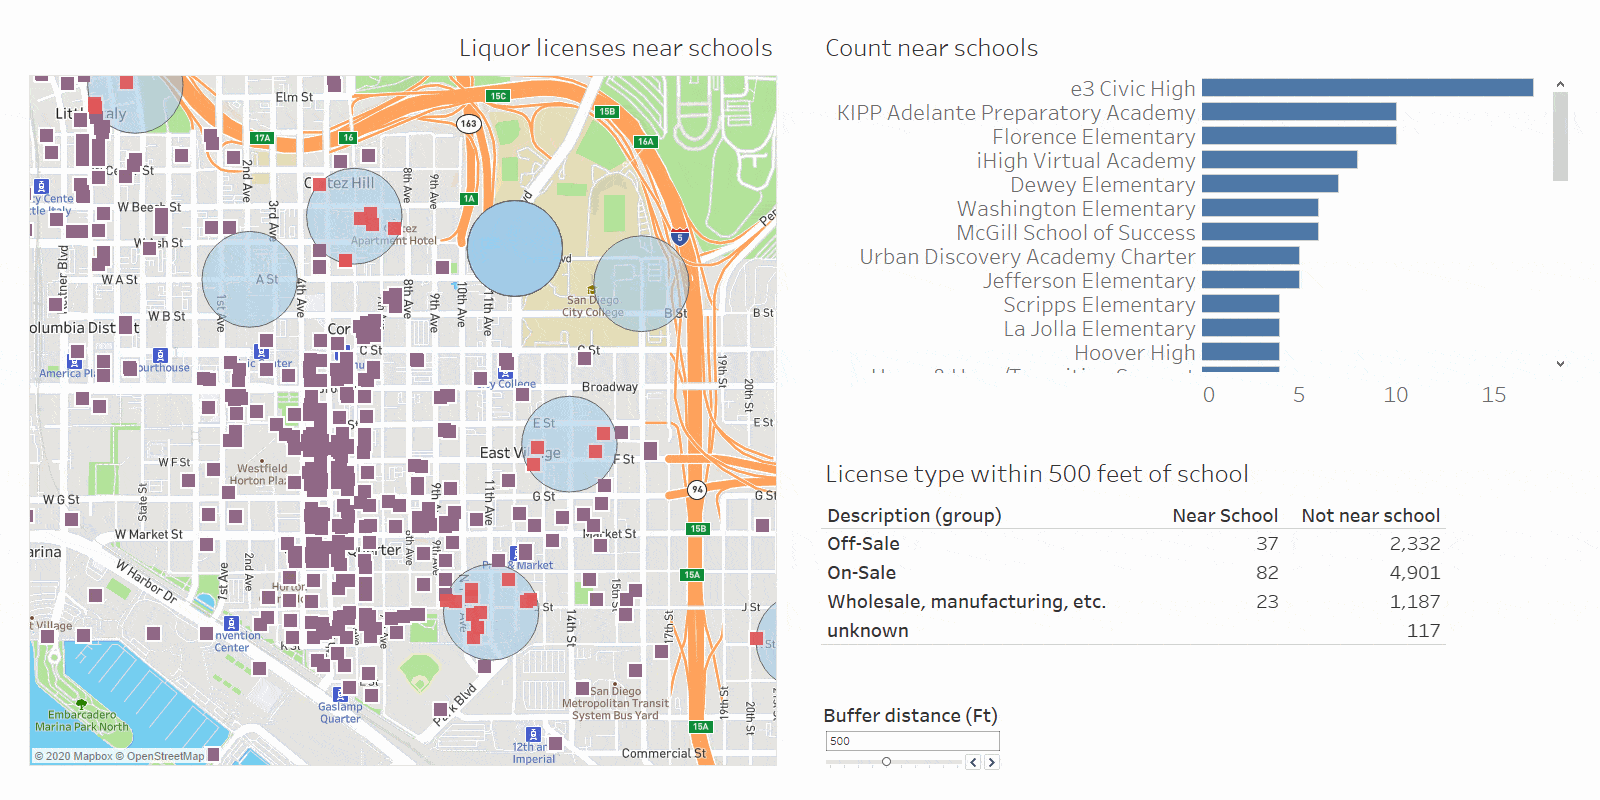
In the worksheet, I can create a dual-axis map, showing licensed stores on top of the school buffers. I can use “Number of Records” to count licensed stores within the specified search radius around schools.

From here, you have all the building blocks you need to build a highly interactive, geospatially-driven dashboard. Here is a dashboard that shows a dynamic buffer around schools, which licensed stores are within or outside of the buffer distance, along with linked views for comparison and summary of schools and store license types.
Your feedback is always welcome
Buffers (and the Distance) function will work with both live and extract connections, and for all data sources in the 2020.1 release. The first release of buffer allows you to work with point locations only. If you want to see buffers work with lines or boundaries, or other spatial functions added to Tableau, please post your idea on the Tableau Ideas Forum.
Articles sur des sujets connexes

VizQL Data Service from Tableau: Use Your Data, Your Way
 août 8, 2024

When and How to Use Multi-fact Relationships in Tableau
 août 1, 2024

Top data books of 2021
 décembre 12, 2021