Scoring your Iron Viz ideas: Results


This blog post is based on the results of a survey created to gather ideas about Iron Viz. More details on that survey and methodology can be found in a previous blog post.
If reading Data Revelations has taught me anything, it’s that analyzing and telling stories with survey data is hard. But try doing that with survey results using methodologies you’ve never used before for an audience like this, on data about a much loved (and often controversial) competition - well, you get the picture. It ain’t easy. So let me share a bit about how we got here.
In December, we surveyed both the community and Tableau stakeholders about Iron Viz. I worked with Lilach Manheim and Maggie Faber to design two surveys that would help us understand what Iron Viz suggestions were most appealing to the community, and how feasible those suggestions were to implement. The community survey, for folks who didn’t take it, was perhaps a little harder to take than we planned. It took me 33 charts and 26 pages of a story points viz to get it all out. Why? Each suggestion had scores for 6 areas, and the ‘result’ depended on the ratio of scores to each other. The suggestions don’t stand alone; many of the suggestions were related, so we couldn’t take any single ‘result’ without considering its dependencies and related suggestions. We also had responses by gender, so we looked carefully at suggestions that seemed to be clearly favorited by one gender or another.

The results are imperfect, but I’m grateful for the guidance I received, for all your feedback and input, and for the patience you’ve shown me. This has certainly been a learning experience. There were so many suggestions (with such varied results) that the Tableau Public team can’t possibly do all of them immediately. But we’d like to call out a few items of note:
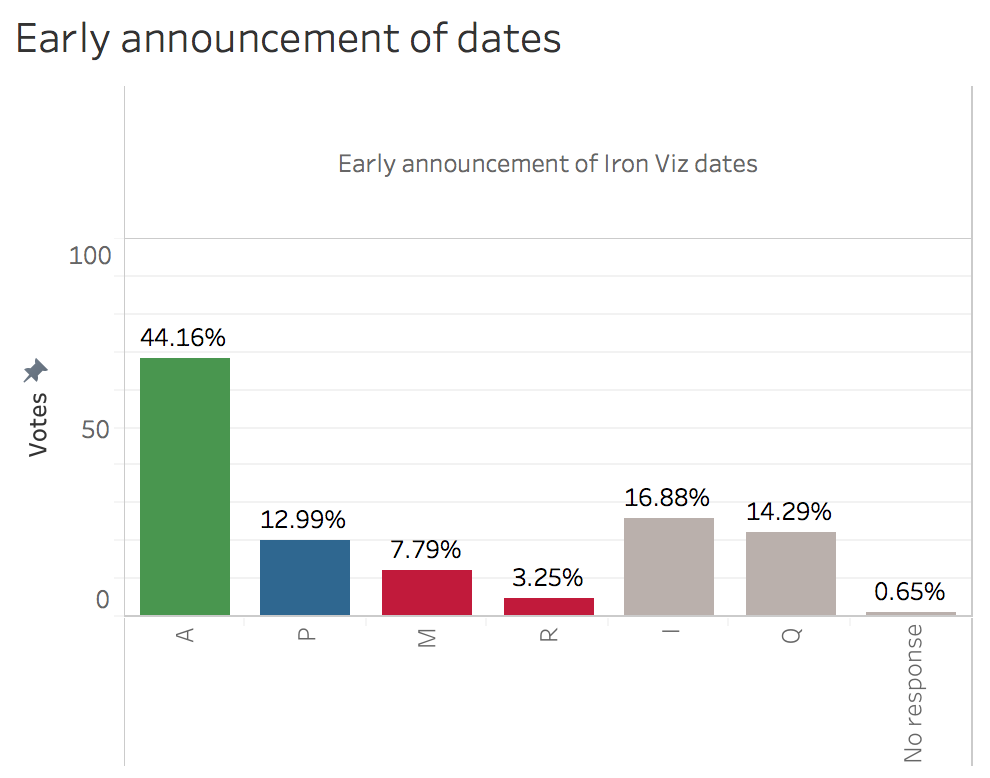
Announcing Competition Schedule
44% of respondents were delighted with the idea of early date announcement. This year we will announce the dates of the feeder competitions from the start! Stay tuned for the competition dates in an upcoming blog post.
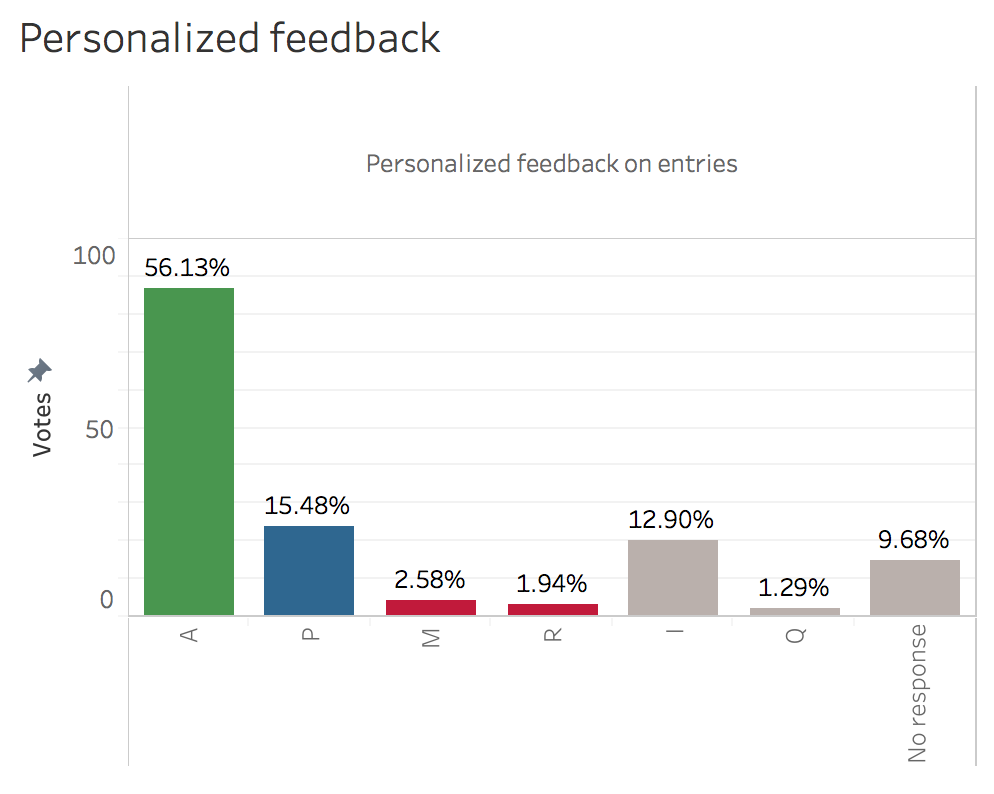
Feedback and Scoring
Personalized feedback was the #1 item in this survey, with 56% of responses as attractive and 15% as performant (meaning it's expected). When you submit your viz, you will now have the option to request feedback and scoring. Submissions will be scored on Storytelling, Design, and Analysis. You can learn about how these categories are defined and more about scoring in the FAQ when the first 2018 Iron Viz competition is announced.
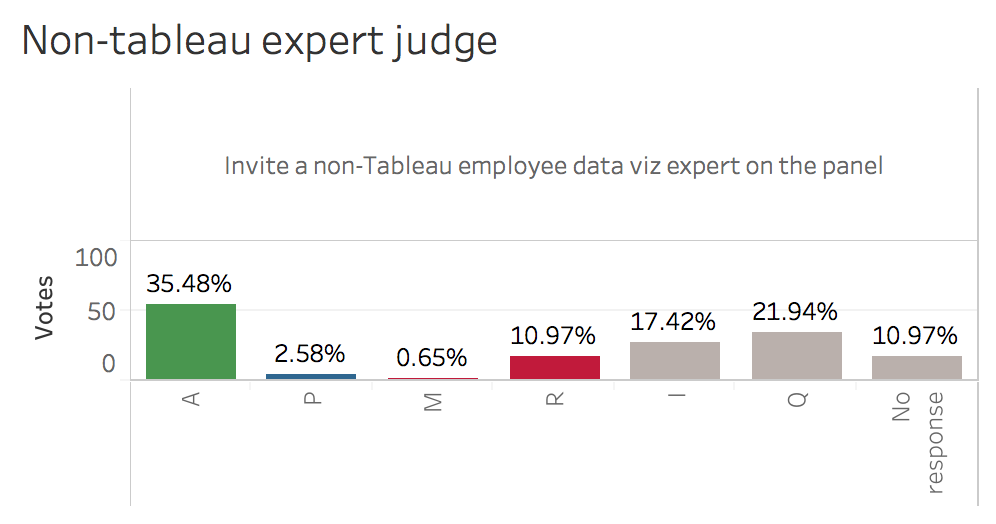
Themes and Guest Judges
35% of respondents liked the idea of guest judges. In addition to the panel of Tableau judges, we will have data viz experts participate in the judging process. The guest judges will be announced at the beginning of the submission window, the same time as the competition theme.
Full list of changes to Iron Viz
These are the changes we are implementing for the Iron Viz competitions in 2018, but you’re welcome to look at the entire results in the viz below.
- Announcing entire 2018 feeder schedule up front
- Providing social media badges for Iron Viz participants
- Providing Tableau swag to top entry in each scoring category
- Highlighting highest scoring submissions in each category on the blog
- Highlighting most favorited submission on the blog
- Collecting feeder competition theme ideas from the community
- Allowing participants to receive their score and judging feedback
- Scoring on the basis of Design, Storytelling, and Analysis (removing "Overall")
- Including guest judges outside of Tableau

In addition to these items, we’ll also provide more transparency to the rest of the Iron Viz program. We don’t want to destabilize Iron Viz, but we want to drive continuous improvements - and be responsive when something we’ve introduced doesn’t work. We’re not always going to get it right, but we know it’s critical that we involve you in the process. When something isn’t working, tell us. If you love something we’ve introduced, shout it from the rooftops (and tell us too)! To all of the Tableau Public community who shared feedback with us, we thank you. Special thanks to Lorna Eden, Emma Whyte, Emily Chen, Eva Murray and Emily Kundfor their surveys that led the way (and informed our results too), and to Ann Jackson and Maggiefor blog posts that kept the discussion in the foreground. Deepest gratitude to Lilach and Maggie for their tireless work monitoring my language for bias and other ethical quandaries in the design of the survey instruments - and for reviewing the entire analysis when it was done.
Articles sur des sujets connexes

Iron Viz 2026: Read Between the Data
 mai 28, 2026

Tableau's Iron Viz Winners

Explore the 2026 Iron Viz Entries
 décembre 15, 2025