What Capabilities Do People Want in their BI platforms? Part 1


This blog entry is part of a series that reviews and discusses recent reports from Gartner.
Some of the most interesting findings in the Gartner reports are organizations’ ratings of the 13 capabilities Gartner says define a BI platform, which you can find in the report titled BI Platforms User Survey, 2011: Customers Rate their BI Platform Functionality. In this blog post and the next, we'll look at a few of these capabilities.
The graphic below shows not only the most used capabilities but also the ones that are being adopted the fastest. The most important capability continues to be reporting, even though its overall use is down. Other capabilities, like Dashboards and Interactive Visualization, are up in use.
Figure 1. Overall Rating of Business Intelligence Platform Capabilities in Meeting Needs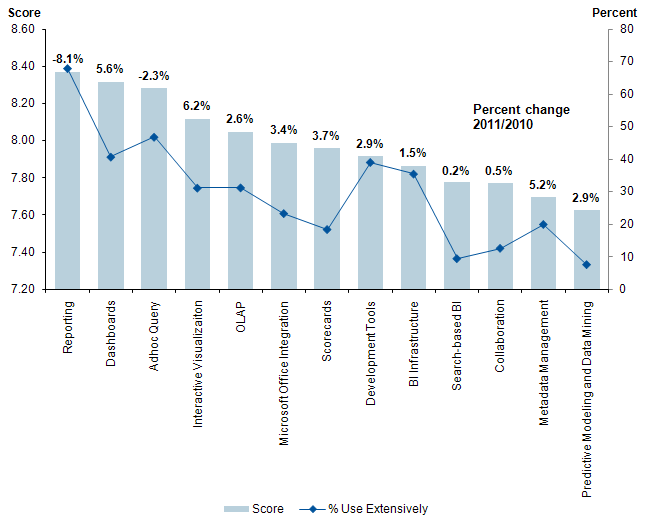
Source: BI Platforms User Survey, 2011: Customers Rate their BI Platform Functionality, 31 March 2011, Rita L. Sallam, Gartner Research Note G00211770
When you look at the vendor rankings for Reporting, you can see Tableau customers use it quite extensively (although not as much as customers of traditional BI vendors).
Figure 2: Satisfaction and Usage: Reporting 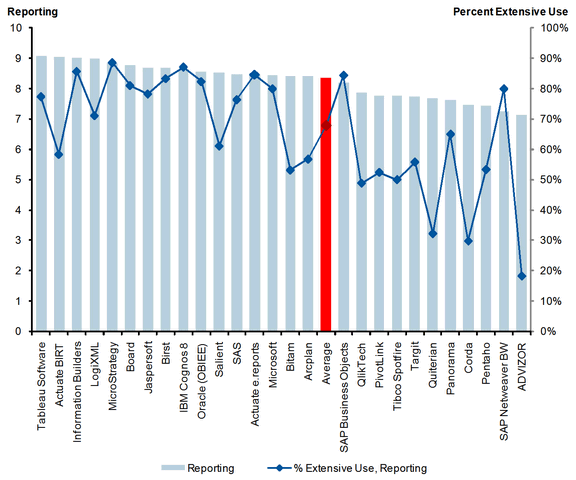
Source: ibid. Chart represents customer perception and not Gartner's opinion.The chart may feature vendors that (in Gartner's opinion) do not deliver the functional capability described.N=1,127
Gartner states that ad hoc querying, like reporting, is another widely used functionality that is declining in importance. “These traditional report-centric approaches are being increasing supplanted by use of interactive visualization capabilities that appear to have grown at their expense.” Interestingly, Tableau users do not make as extensive use of ad hoc querying probably for the reasons Gartner cites.
Figure 3: Satisfaction and Usage: Ad Hoc Query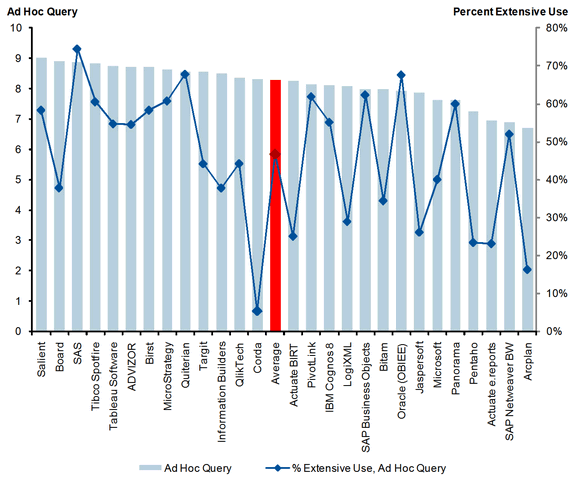
Source: ibid. Chart represents customer perception and not Gartner's opinion.The chart may feature vendors that (in Gartner's opinion) do not deliver the functional capability described.N=1,127
Tableau has made the full Magic Quadrant report and the supporting Gartner detailed reports available at no charge at http://www.tableau.com/gartner-business-intelligence-mq-2011.