 Tableau Research
Stepping through Charted Territory: Creating Interactive Step-by-Step Dashboards Tours
 6 月 8, 2025
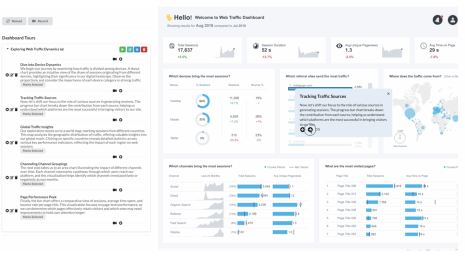
Tableau Research presents DashGuide, a system for (very) easy GenAI assisted authoring of dashboard guides for onboarding, storytelling, and everything else in between.
6 月 8, 2025
Tableau Research presents DashGuide, a system for (very) easy GenAI assisted authoring of dashboard guides for onboarding, storytelling, and everything else in between.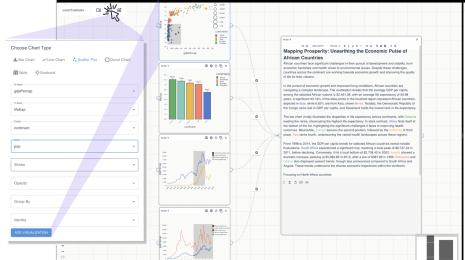 Tableau Research
Visualize, Narrate, Repeat: Closing the Loop on Data Storytelling
 6 月 2, 2025
Tableau Research presents DataWeaver, a tool that connects text and visuals through seamless, bidirectional workflows for authoring compelling data stories.
6 月 2, 2025
Tableau Research presents DataWeaver, a tool that connects text and visuals through seamless, bidirectional workflows for authoring compelling data stories.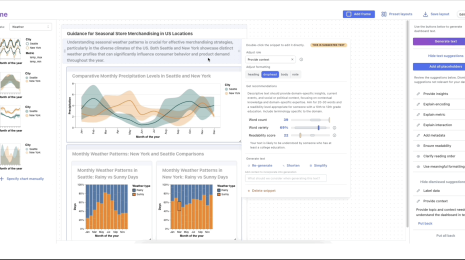 Tableau Research
Co-Authoring Dashboard Text with AI
五月 29, 2025
Tableau Research presents Plume—a system to scaffold dashboard text authoring with multiple levels of automation support.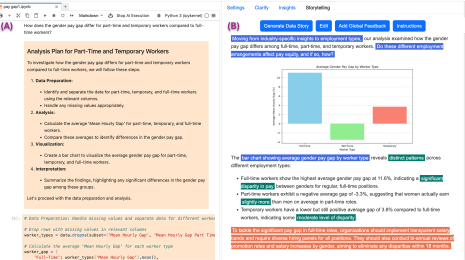 Tableau Research
Unlocking Actionable Insights with Jupybara: A Multi-Agent AI Assistant for Data Analysis and Storytelling
 五月 23, 2025
Tableau Research presents Jupybara—a multi-agent AI assistant that helps analysts turn data into clear, persuasive, and actionable stories—right inside Jupyter Notebooks.
五月 23, 2025
Tableau Research presents Jupybara—a multi-agent AI assistant that helps analysts turn data into clear, persuasive, and actionable stories—right inside Jupyter Notebooks. Tableau Research
AI-Assisted Authoring of Text and Charts for Data-Driven Communication
 4 月 4, 2025
Tableau Research presents Pluto—a mixed-initiative tool that helps authors create semantically aligned text and charts through smart, contextual suggestions.
4 月 4, 2025
Tableau Research presents Pluto—a mixed-initiative tool that helps authors create semantically aligned text and charts through smart, contextual suggestions. Tableau Research
Beyond the Default: Customizing Automated Data Insights with GROOT
10 月 24, 2024
Tableau Research introduces GROOT— a system that lets users customize automated data insights, addressing the challenges of rigid, predefined insight generation tools. Tableau Research
Beyond the Visuals: Elevating Text as a First-Class Citizen in Dashboard Design
10 月 16, 2024
Tableau Research explores the critical role of text in dashboard design, highlighting best practices and future opportunities for integrating text to enhance data communication and user interaction. Tableau Research
Exploring Data Uncertainty through Speech, Text, and Visualization
8 月 9, 2024
Learn more about work at Tableau Research on how speech, text, and visualization modes communicate data uncertainty, impacting decision-making and trust. Tableau Research
Exploring Spatial Computing and Immersive Analytics with Vision Pro
7 月 31, 2024
Tableau shares how Apple Vision Pro enhances Tableau's immersive analytics with 3D visualizations and spatial interactions. Learn about app design, user feedback, and future directions in data exploration.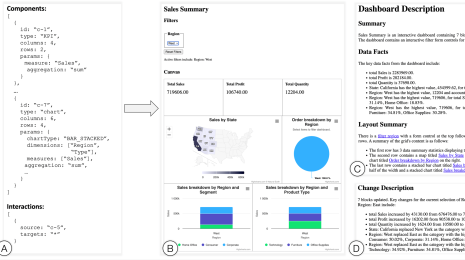 Tableau Research
Designing Accessible Dashboards for Screen Reader Users
12 月 1, 2023
Tableau Research explores techniques to make visualization dashboards more accessible to screen reader users. Tableau Research
Adding Speech Interaction to Tableau Gestures
 11 月 17, 2023
Tableau Research demonstrates the use of gesture and speech interaction in parallel to deliver compelling augmented reality video presentations about data to remote audiences.
11 月 17, 2023
Tableau Research demonstrates the use of gesture and speech interaction in parallel to deliver compelling augmented reality video presentations about data to remote audiences. Tableau Research
Quantifying Semantic Labeling of Visual Features in Line Charts
10 月 25, 2023
Tableau Research presents at IEEE VIS 2023: ‘What Is the Difference Between a Mountain and a Molehill? Quantifying Semantic Labeling of Visual Features in Line Charts.'