ThoughtStorm Effectively Engages their Data with Tableau
ThoughtStorm is an investment portfolio company providing financial advisory services, interim management services, and strategic planning services for a variety of clients ranging from Charles Schwab to Google. Though ThoughStorm serves a wide range of clients, they all have a common need: evaluate large amounts of data in order to come up with business strategies faster, easier, and more effectively.
ThoughtStorm’s co-founder and managing director, Mike Princi, explains that prior to using Tableau, ThoughtStorm worked a team of SQL programmers, analysts and statistical experts to evaluate their data. What they found was often many of the analysts didn’t understand the strategic and management considerations of the financial experts, while the financial experts are not able to spend time running complex statistical software. Overall, ThoughtStorm was losing time and ground. Princi was a former infantry ground officer, so losing ground was unacceptable.
We wanted to be able to draw insights looking at key performance areas - online advertising, operations, and customer service.
Drawing Insights on Key Performance Areas
Princi tells how Tableau was able to dramatically increase the speed and effectiveness of their analytical capabilities. He recalls, “We were approached by an internet apparel retailer that at that time was specifically focused on lingerie. They needed us to provide financial backing with a letter of credit so they could buy inventory. So we jumped in, but it quickly morphed from a model that was us providing simply financing to us taking a controlling stake in the business.” He continued, “In the year and a half they were in the business they collected a tremendous amount of data, but were not able to really draw any conclusions. This is often the problem when you’re given a lot a data - you’re not really sure what to do with it.”
Princi wanted to use the data to drive decisions. “The historical method of looking at this data is very slow and time consuming, but in a short time we needed to make decisions and understand the dynamics of the business in order to create greater returns. We wanted to be able to draw insights looking at key performance areas – online advertising, operations, and customer service. Our goal was to get a set of metrics that tell how the business is responding to any of the changes we might propose, as well as the potential for organic verses acquisitive growth”.
Knowing What Questions to Ask
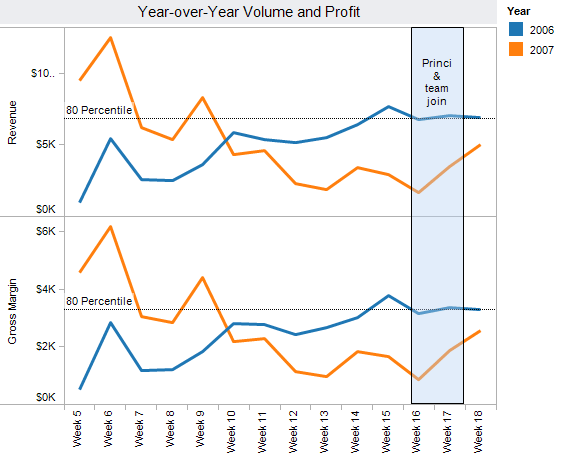
Princi and his team began exploring the data. “We started to track gross margins, number of orders, and total revenue to see the difference between this year and last year over the same time period. The thing that jumped out was absolutely business was doing much better in 2006 during the same time period, so we started to ask questions as to why that was.” They isolated one important factor: “We didn’t have magnitude of the back order and fill rate issues in the beginning that we now currently have.”
This first snapshot gives a sense of where things stood when ThoughtStorm came on board.

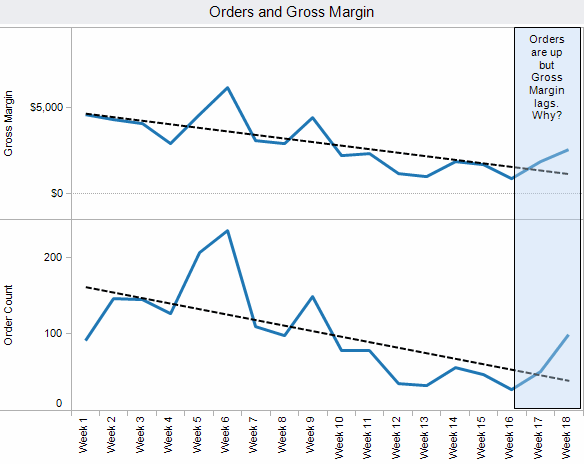
Princi started making changes right away. “We immediately took action to start pushing volume into the business, doing things with ad placements, increased search engine optimization, our affiliates program, and a direct mailing to previous customers. The next place it was clear we needed to shift our attention was revenue per order, so we began to lay out some plans for that as well.”
Princi adds, “We were only three days old into Tableau when these changes were made.”
Next Princi looked at revenue per order. “This snapshot shows where we were when we jumped on board in week sixteen, and you can see there had been a strong downward trend. You can see how our actions were working on the volume side and reaffirmed what we already saw in our other snapshot - we now needed to give more attention to the revenue-per-order side.”

Preparing the Business for Significant Growth
Princi continued to work to identify the drivers of the business. “With all of the actions we were taking we wanted to make sure everyone was on track to prepare to grow the business in a very significant way, so we looked at what could be done to affect people who are in charge of the business on a day-to-day basis. The real value drivers are cost control and efficiency, so if we have a better understanding of these it gives us the ability to give guidance to the folks running the customer service and shipping centers.”
In conclusion Princi said, “During this time what we accomplished using Tableau was several things: We were able to understand what was happening in the business. Second, we were able to create a set of plans that were related to how the business operated from the bottom up. Third we were able to implement a very quick set of management polices that allowed us to implement a model that gave us very strong insights about the business, and the performance of our business.”
For More Information About This Case
Contact: visualanalysis@tableau.com or call (206) 633-3400 x1