Support and Service Analytics

The world's leading businesses use data to optimize customer experiences, improve customer satisfaction, and earn customer loyalty. Analytics give them the deep visibility into their customers and the understanding of service operations they need to deliver best-in-class customer support. Learn how Tableau can turn data into your service and support team's super power.

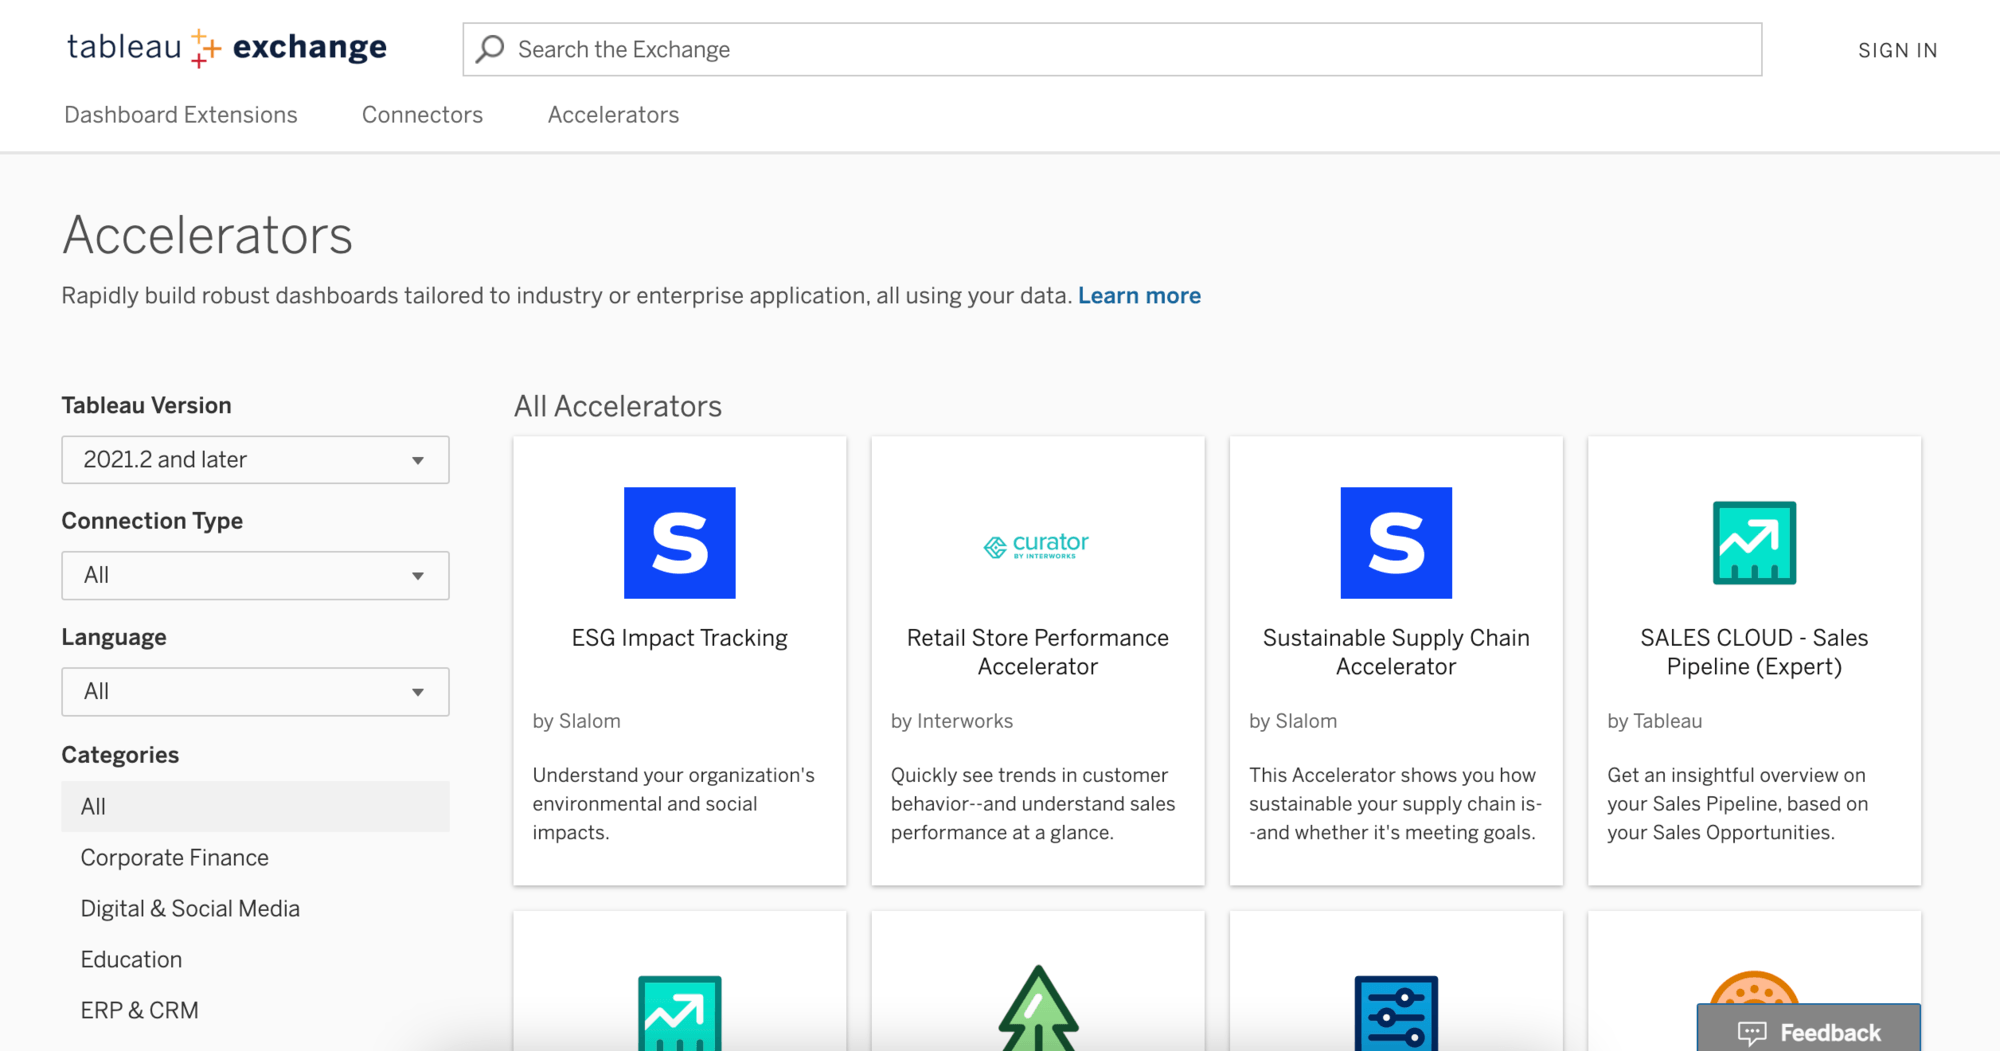
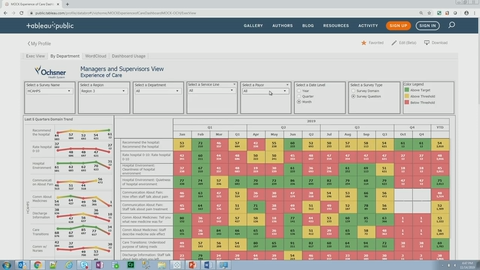
Jump start analysis with Tableau Accelerators

Get expert-built dashboards to address support and service specific business needs with Accelerators on the Tableau Exchange.

Explore accelerators

Customer service analytics during a pandemic

Case Study

Verizon uses COVID-19 Data Hub to understand customer needs

Verizon adapted their dashboards to incorporate data from the Tableau COVID-19 Data Hub, enabling them to see spikes in service demand relative to pre-COVID median levels, and adjust resources accordingly.

Case Study

Tableau uses analytics during response to pandemic

Tableau created a new process to address COVID-specific concerns, tracking the number of requests, their statuses, the employees resolving them, and more, to optimize the workflow and solutions being offered.

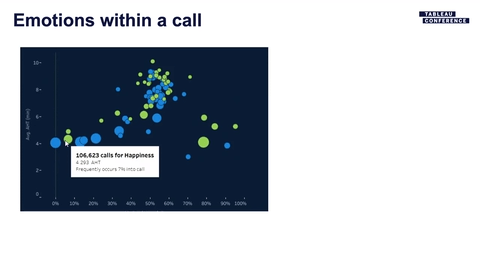
Whitepaper: Four Strategies to Transform Customer Service With Analytics

Yesterday’s customer support organizations needed leaders capable of motivating their call center teams while driving efficient operations. Today’s customer support organizations leaders must deliver on that same goal, but also create a differentiated customer experience. Learn four proven strategies customer service leaders are using to transform their organizations with analytics.

Read the interactive whitepaper

Tableau Accelerators for Salesforce and ServiceNow

Accelerators will help you hit the ground running with your service data minutes. In just a few clicks, you’ll be able to connect and create beautiful, data-rich dashboards seamlessly.

Salesforce Accelerators for Service Cloud

Accelerators for Service Cloud help you set targets for your critical customer service metrics and track your cases by priority.

ServiceNow Accelerators

Tableau's Dashboard Starters for ServiceNow help you track incidents and problems and allocate resources to them.

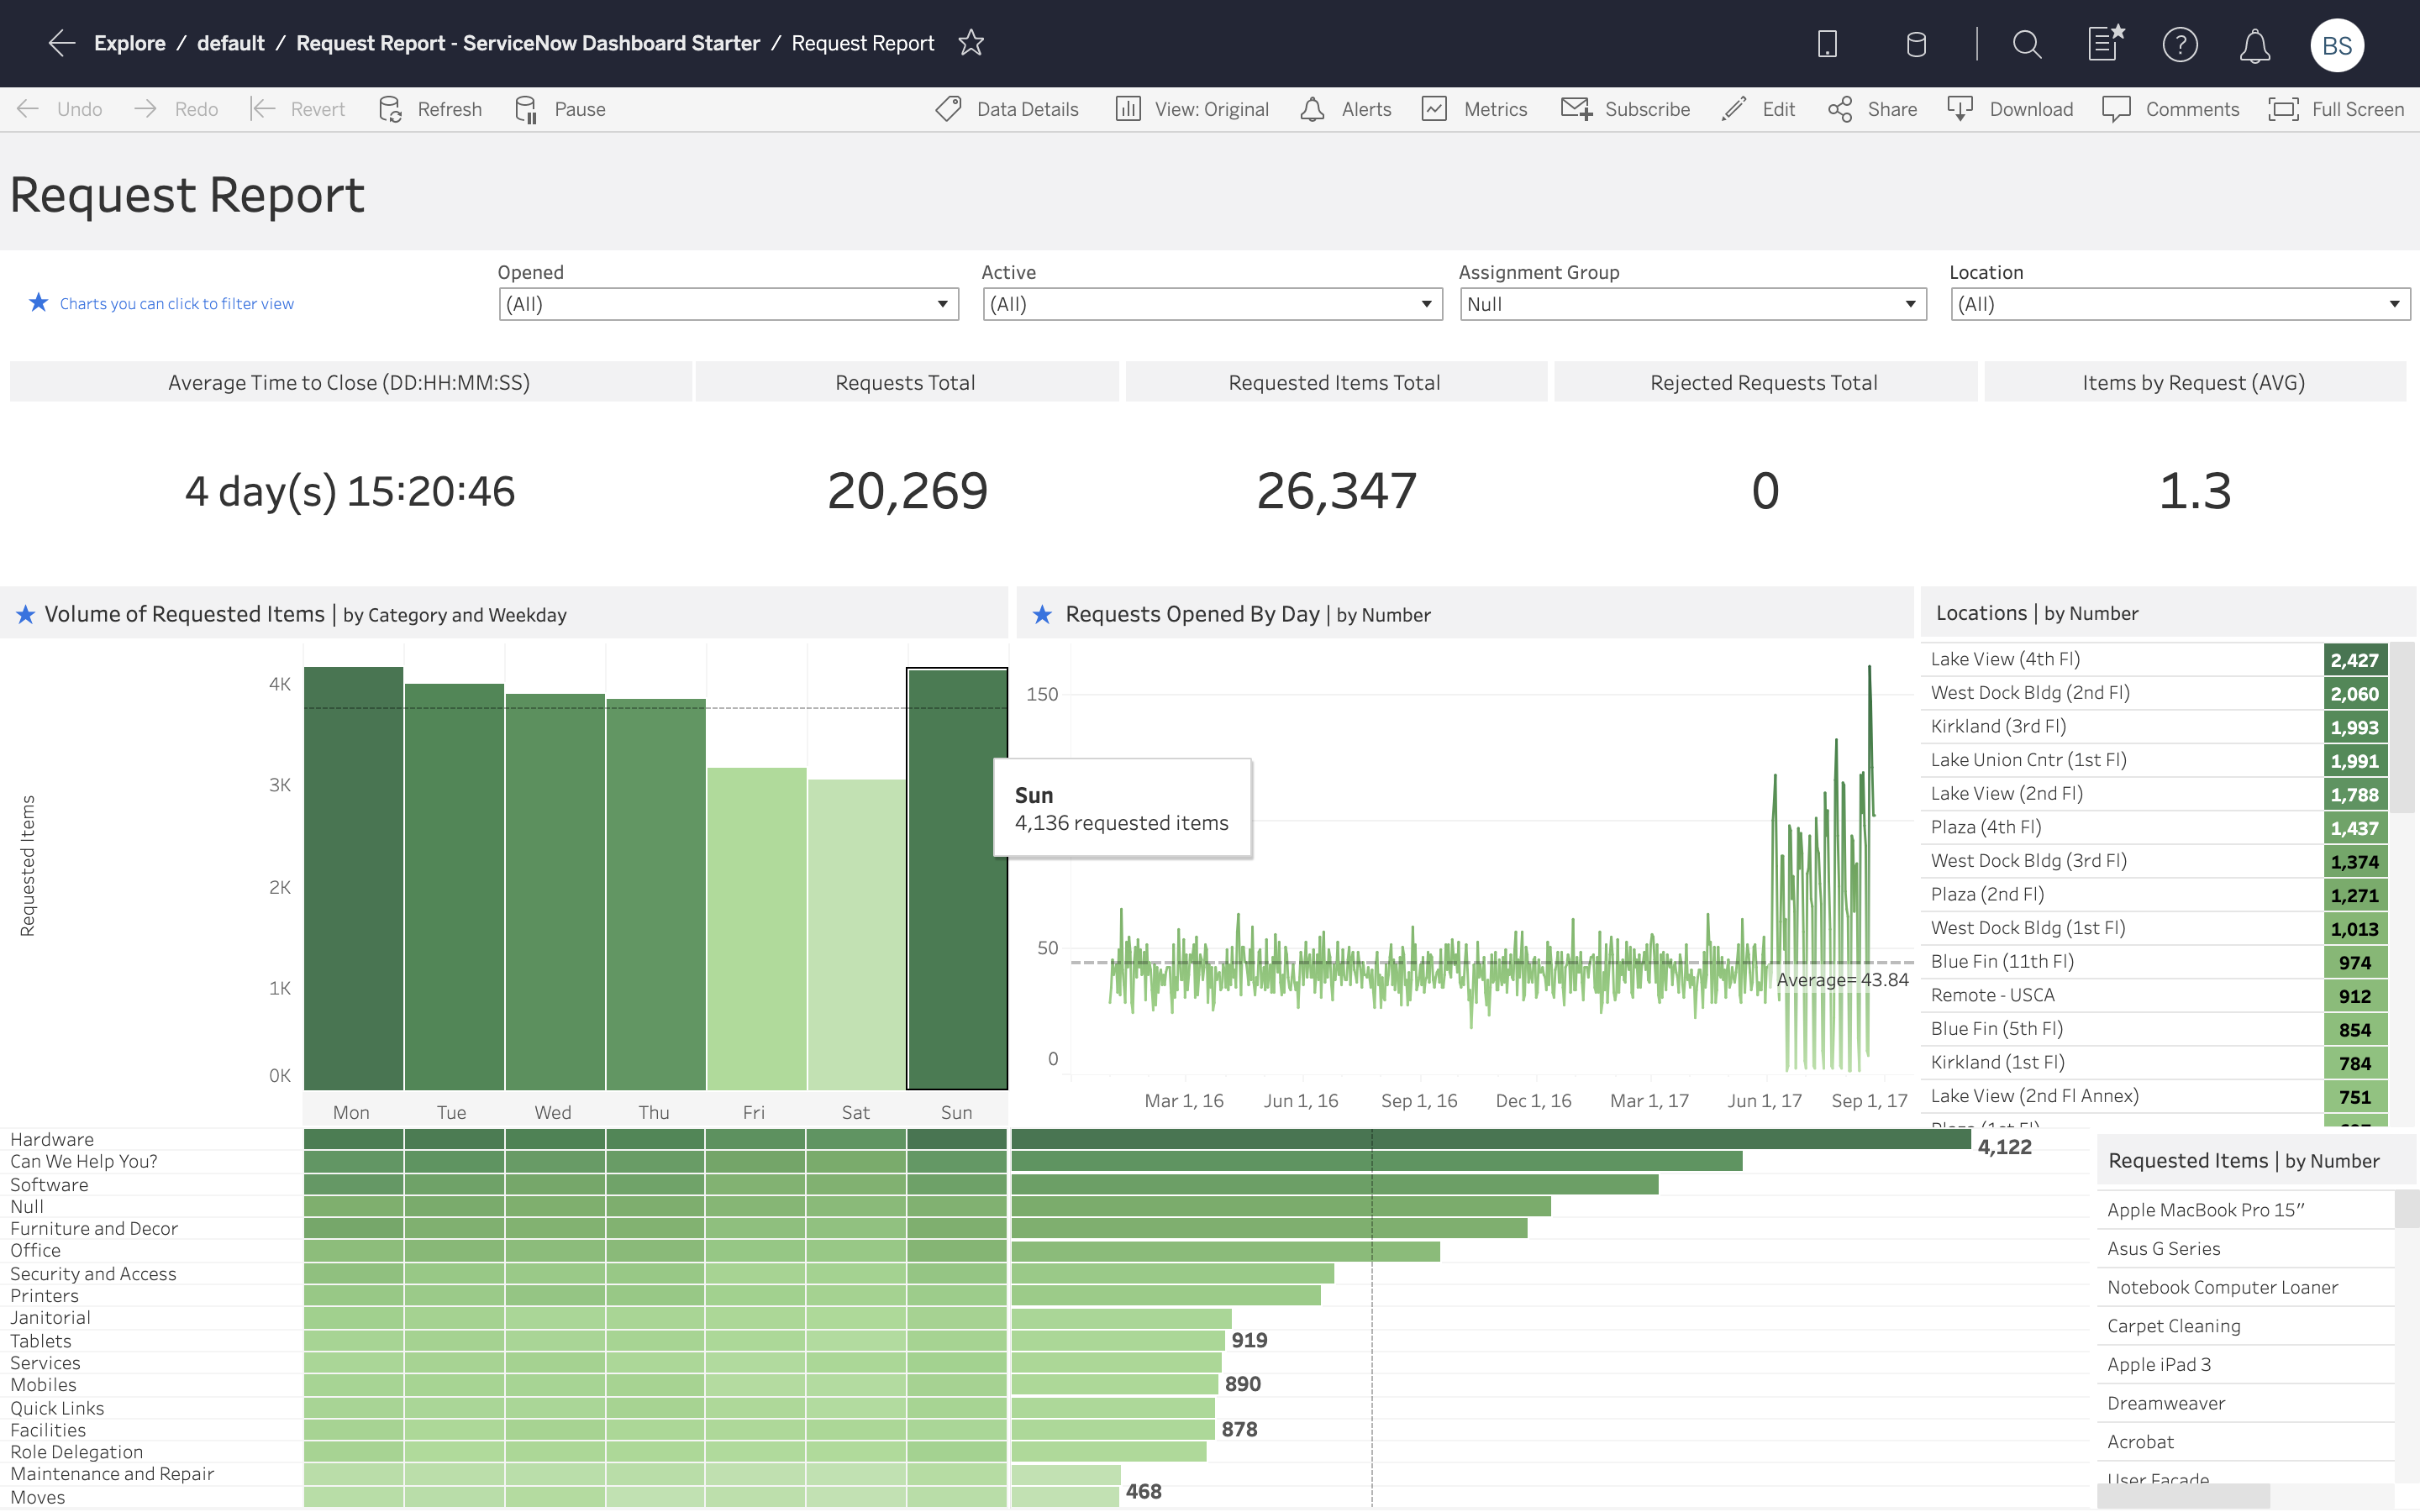
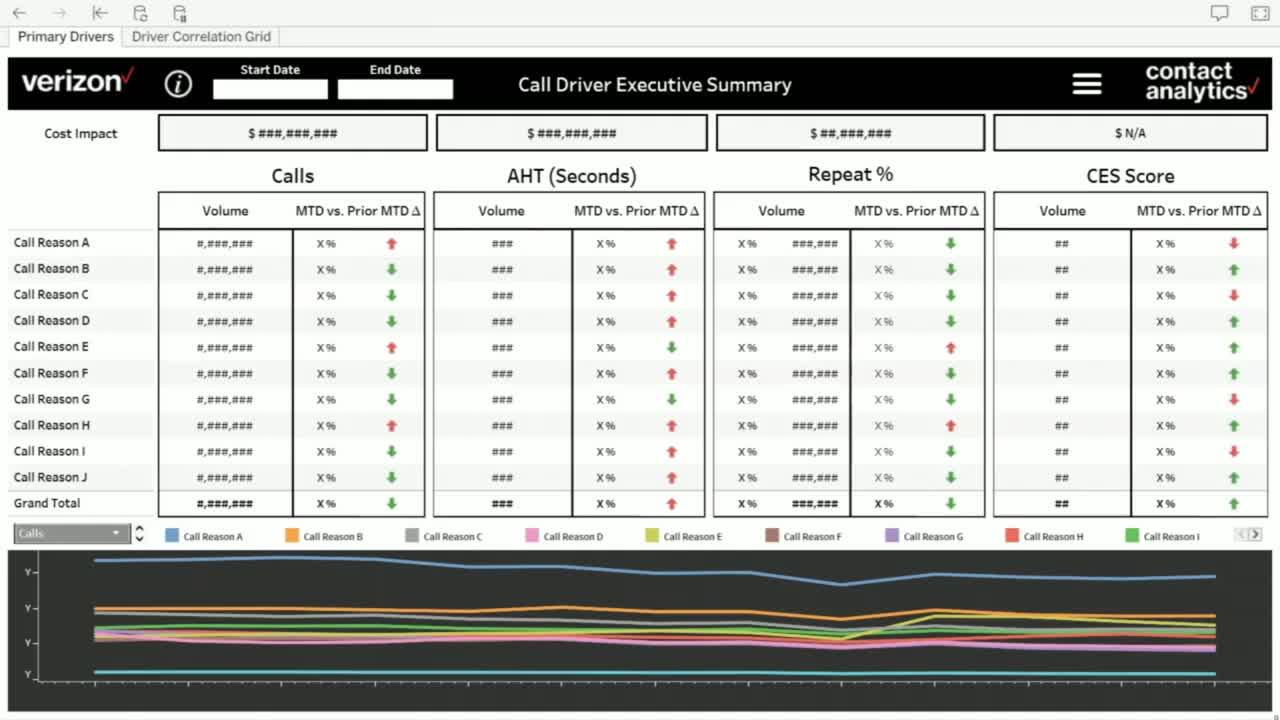
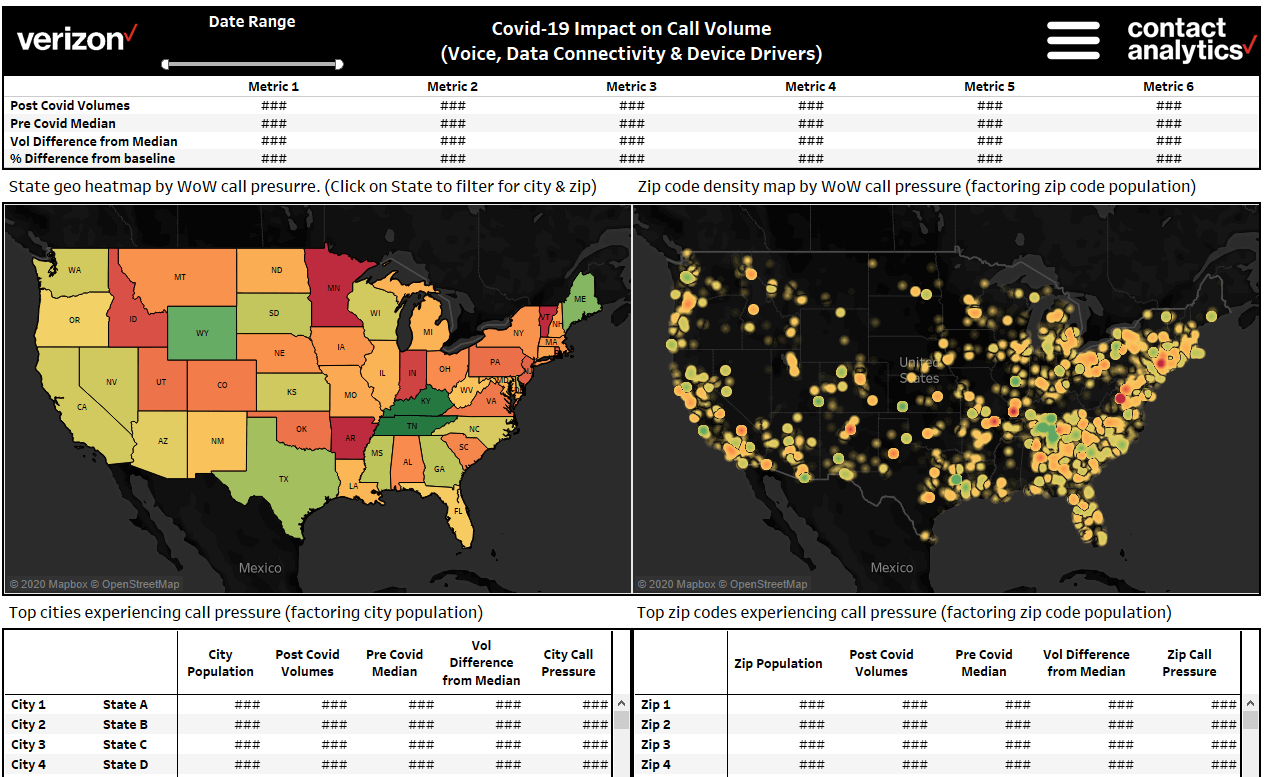
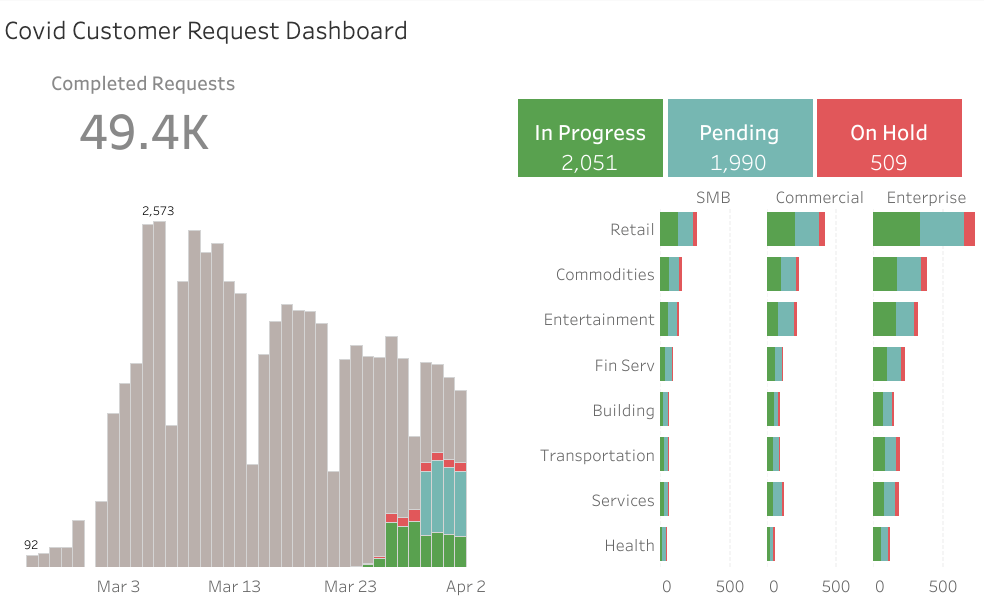
Verizon reduces support calls, improves customer experience

Verizon Fios, the provider of broadband Internet, landline voice, and cable TV, used Tableau to:

  • Cut customer service analysis time by 50% across call center, digital and dispatch teams
  • Reduce call volume by 43% and tech dispatches by 62% for certain cohorts of customers
  • Create 1,500+ dashboards ingesting billions of rows of data from Hadoop, Teradata and Oracle
Watch the video

Charles Schwab analyzes call center data

One of the largest publicly-traded financial services firms, used Tableau to:

  • Look at how interactions (like the customer service line) affect the overall customer experience
  • Understand and improve the flow of calls through the company's IVR technology
  • Share the voice of the client with support staff and all the way to executive vice presidents

Southwest Spots Call Center Process Improvements

The largest carrier of domestic passengers in the U.S. used Tableau to:

  • Consolidated data stored in Microsoft SQL Server and Teradata
  • Create a universal view of call behavior
  • See real-time feedback on team performance scores and representatives

PEMCO provides fast, accurate claims handling

The insurance company used Tableau to:

  • Single dashboard used to track all open insurance claims
  • Comprehensive server management spanning 500+ users
  • 76% of Claims department employees use Tableau every month