KPI Monitoring and Data Analysis Environment Migrated to Tableau
All Forms Usable After Four-Month Migration Period
Background Behind Deployment
Enduring service and long-term relationships
SmartNews, Inc. coordinates with national newspapers and other news media and operates "SmartNews," a smartphone app that delivers personalized news that is trending online. In 2014, it began operations in the U.S., and the app has now been downloaded over 50 million times by users around the globe. It is now known as the news app with the highest average per-user monthly usage time. In the future, it is looking to expand its services to all regions and languages.
The SmartNews app is free to use, generating revenue through advertising. SmartNews has agreements with various media to provide appealing news content and offers users greater ease of use, while at the same time focusing on optimizing ad delivery. To maintain the proper balance, it is vital to visualize and analyze data such as logs, which are all recorded in digital form.
As KPI, it uses app user data such as MAU (monthly active users), WAU (weekly active users), and DAU (daily active users), article impressions, clicks, ad impressions, views, and other key figures. These are used in various ways, and almost every department in the company requires KPI monitoring and data analysis capabilities.
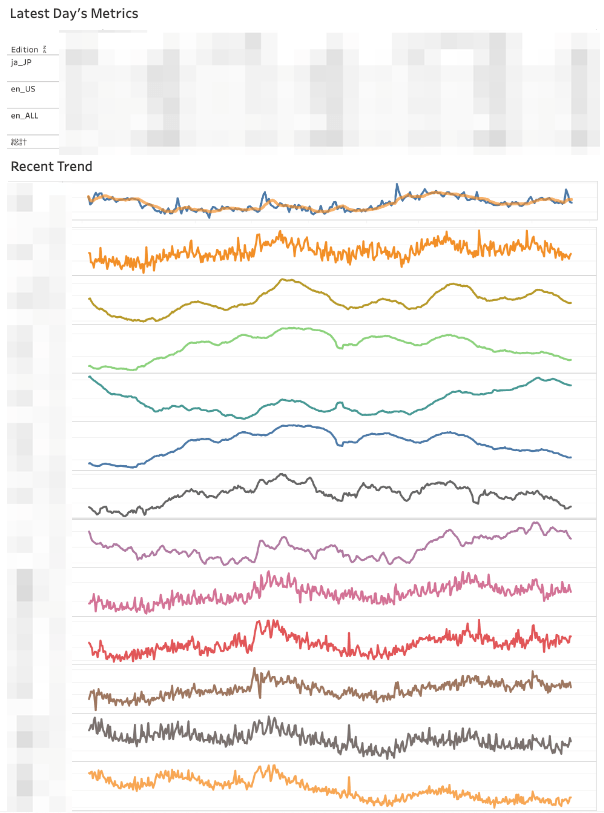
SmartNews has an established culture of using dashboards in all kinds of situations. For example, when performing A/B testing with the aim of improving the app, a dashboard is created to visualize models for maximizing ad revenue and creating more usable designs. It tries to look at things from a variety of perspectives to find better solutions.
Tableau Deployment and Operation Environment
Deepening the company's data-driven culture
Almost all of SmartNews's employees worldwide utilize Tableau Online and Tableau Data Management to visualize and analyze all kinds of data related to their work. Since the company was established, it has had a data-driven culture, and by providing all employees with the flexible Tableau environment, it aims to deepen this culture.
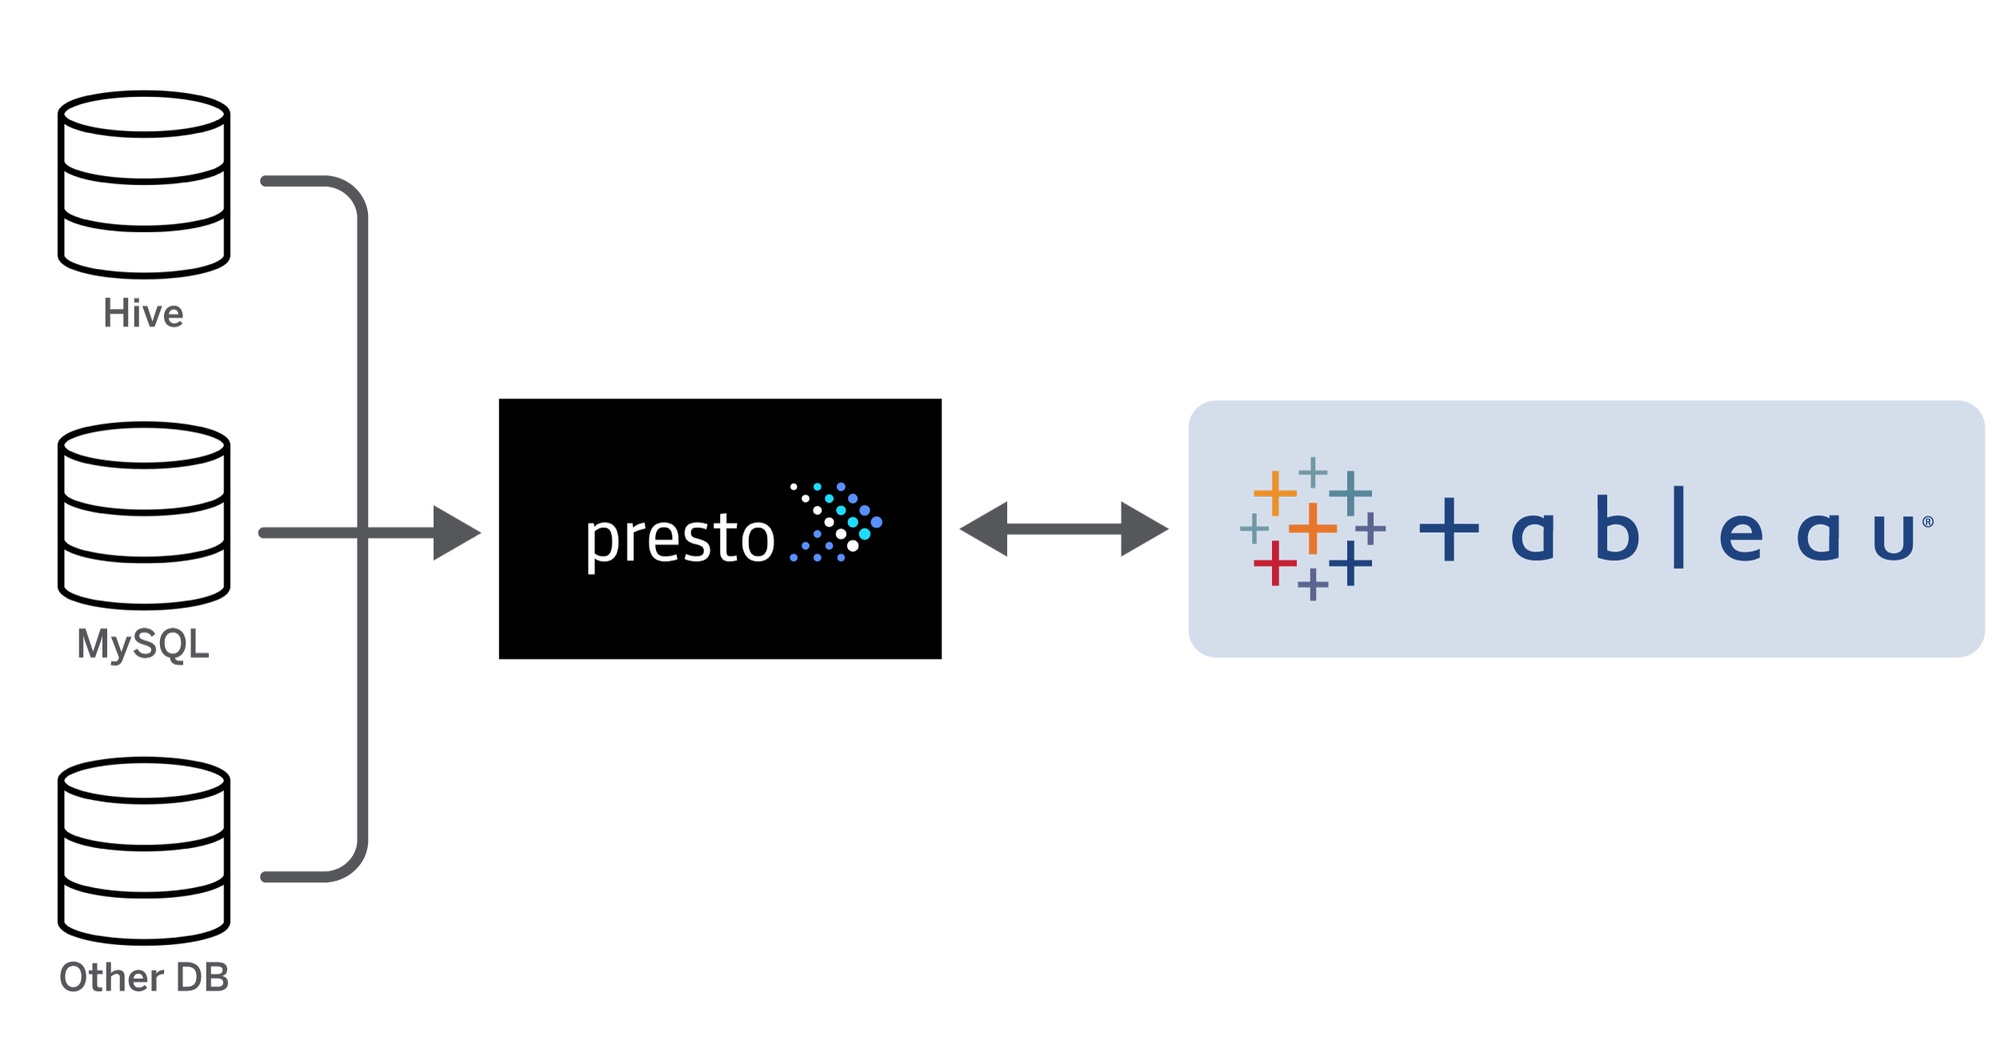
The majority of the data used in its operations is stored in a Hive data warehouse built on Hadoop and is normalized with Presto Hive Connector. Tableau can link not only to this main data warehouse, but also to other sources, freely extracting data as needed and displaying it visually in a dashboard.
To promote greater use of Tableau, it prepared roughly 50 documents on topics such as how to create dashboards and how to connect to databases. It also created an extensive FAQ and a dedicated Slack channel. 632 employees have logged in within the past 90 days. For 150 heavy users, such as data scientists and BI analysts, it provides Tableau Creator licenses, which make it possible to use advanced functions such as connecting to data sources.
"It's only been 8 months since we began full-fledged use of Tableau, but everyone is using it so much that we're already reaching the limits of our storage," says Kuan Li.
It's only been 8 months since we began full-fledged use of Tableau, but everyone is using it so much that we're already reaching the limits of our storage

Reason for Choosing Tableau
Enduring service and long-term relationships
Before deploying Tableau, SmartNews had been a long-time user of a global BI platform. However, in 2021, the service announced that it would be shutting down. The tools provided by the service were essential to SmartNews's business, so it was vital that the company find a solution to replace it.
"I didn't want to go through that ever again," recalls Li. "For the replacement, we needed to choose a tool that we could trust wouldn't be discontinued." SmartNews compared and considered three tools. After a two-month trial period, it chose Tableau based on a holistic evaluation that included the fact that Tableau could be used with peace of mind, the richness of its functions, its look and feel, and its usability.
The migration phase was roughly four months long. Some of the company's existing forms issued complex queries, so the study took time. Three members of Li's team worked on the project full-time. They were joined by contract employees that assisted with the migration, forming a 20-person migration team. This team completed its project of migrating 3,000 forms used by the previous tool.
Benefits of Deploying Tableau
Retaining polished data
With the tool previously used by the company, the data logic and screen presentation were integrated. Because of that, expressing something required complex logic to be constantly running in the background. Tableau, on the other hand, excels at the simple extraction of data from data sources and its visualization.
"I feel like Tableau's basic approach is similar to that of Excel," says Li. Of course, Tableau is also capable of complex analysis, and it provides even greater performance through the attention it pays to the data source end. Tableau offers far superior expression capabilities, and comes with various expression formats by default. By retaining data in a polished form, it is able to provide users with the information they need in a more visual, easier to understand way than was possible before.
Being able to fully use its flow assists in this area. It has been well-received for just how easy it is to understand and its ability to efficiently prepare data. When users encounter specific issues as they use Tableau more extensively, or when they are unsure about how to visually express data, they can post questions to "Tableau Community," a community of users. The community can often resolve these issues.
"Tableau is widely used, so it's also possible to find solutions by Googling them. Of course, during any migration process, there will be some dissatisfaction until people get used to the new system, so there was some of that. However, some employees had been using Tableau at previous jobs, and many employees have an understanding of SQL, so people grew comfortable using it even faster than we had expected," says Li.
Future Steps
Solving storage problems and deepening use
The most pressing issue facing SmartNews is storage space. This problem is the result of the unexpected speed with which employees have taken up Tableau. At one point, 400 dashboards were created in a single week. The company is rapidly working to resolve this problem.
Getting users to use Tableau at an even deeper level is another major challenge. SmartNews is working to enhance its coordination with the Tableau Customer Success Team so that not only heavy users with Creator licenses, but also regular users with Viewer licenses, who can only view existing dashboards, are able to use Tableau more efficiently.