Tableau
Tableau trasforma i tuoi dati in decisioni di cui ti puoi fidare. Metti a disposizione di ogni team informazioni intelligenti, proprio quando sono necessarie, per agire più velocemente e in modo più intelligente. Sfrutta l'innovazione in ogni fase con una piattaforma di analisi connessa e adattabile.
Che cos'è Tableau? Prova gratis
Guarda oraEsplora la gamma di prodotti di Tableau
Tableau Cloud
Una piattaforma di analisi completamente in hosting e basata sul cloud, per connettersi ai dati e analizzarli con efficaci analisi visive, condividendo poi le informazioni in tutta sicurezza senza dover gestire server o infrastrutture.
Tableau Server
Una piattaforma di analisi in hosting autonomo per il pieno controllo della distribuzione dei dati e dell'analisi, mediante implementazione nella propria infrastruttura o nel cloud (istanze private e pubbliche).
Tableau Next
Una piattaforma di analisi aperta che combina intelligenza artificiale, dati affidabili, architettura modulare e integrazione diretta nel flusso di lavoro, per passare dalle informazioni alle azioni in modo più veloce e intelligente che mai.
Tableau Desktop
Un ambiente gestito e flessibile che consente di esplorare, modellare e visualizzare i dati in qualsiasi momento, ovunque, anche offline, per scoprire informazioni intelligenti e agire rapidamente.
Inizia con i dati. Prosegui con Tableau.
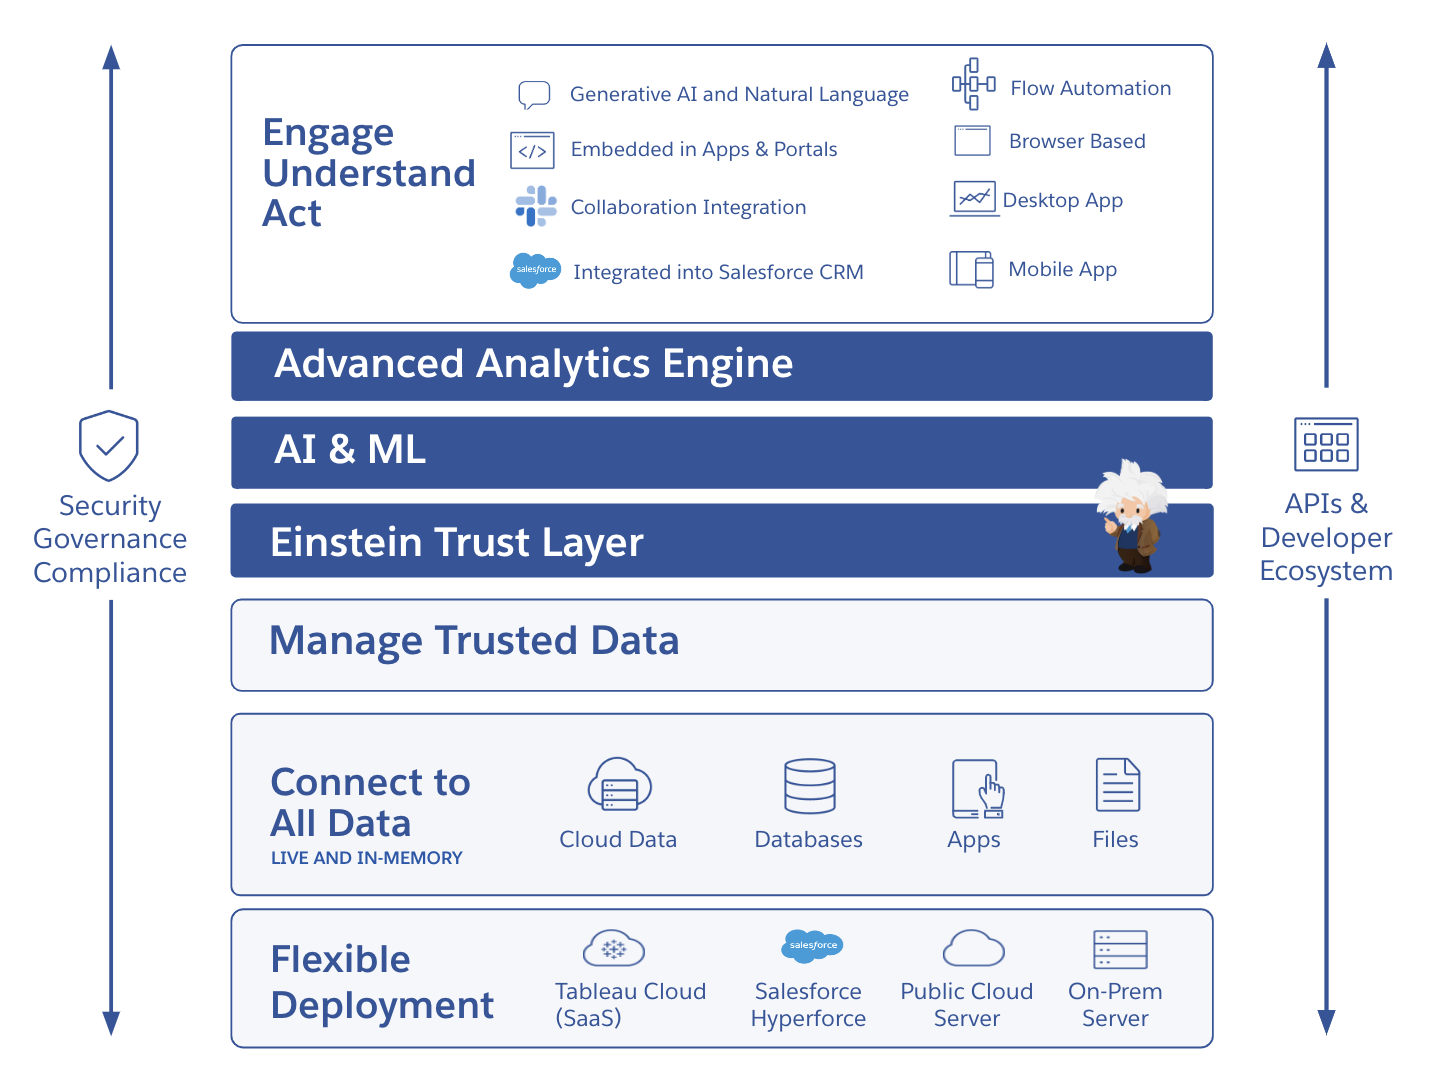
Tableau mette a disposizione una piattaforma di analisi self-service sul cloud facile da usare e progettata per farti trovare le informazioni direttamente nel tuo ambiente di lavoro. Implementa subito una soluzione di AI affidabile per diversi casi d'uso dei dati e dell'analisi con Salesforce Einstein, che si estende in profondità nel livello semantico e nei flussi di lavoro. Con la governance dei dati, la sicurezza e la conformità integrate, Tableau offre i massimi livelli di scelta e flessibilità, rimanendo al passo dell'evoluzione della tua tecnologia e della tua strategia nel campo dell'AI.
Tableau si impegna a soddisfare le esigenze delle organizzazioni di tutto il mondo con il più grande ecosistema di partner e di successo, tra cui l'appassionata community di Tableau da cui puoi ricevere insegnamenti, supporto, confronto e approvazione in ogni fase del tuo percorso con l'AI.
Caratteristiche principali
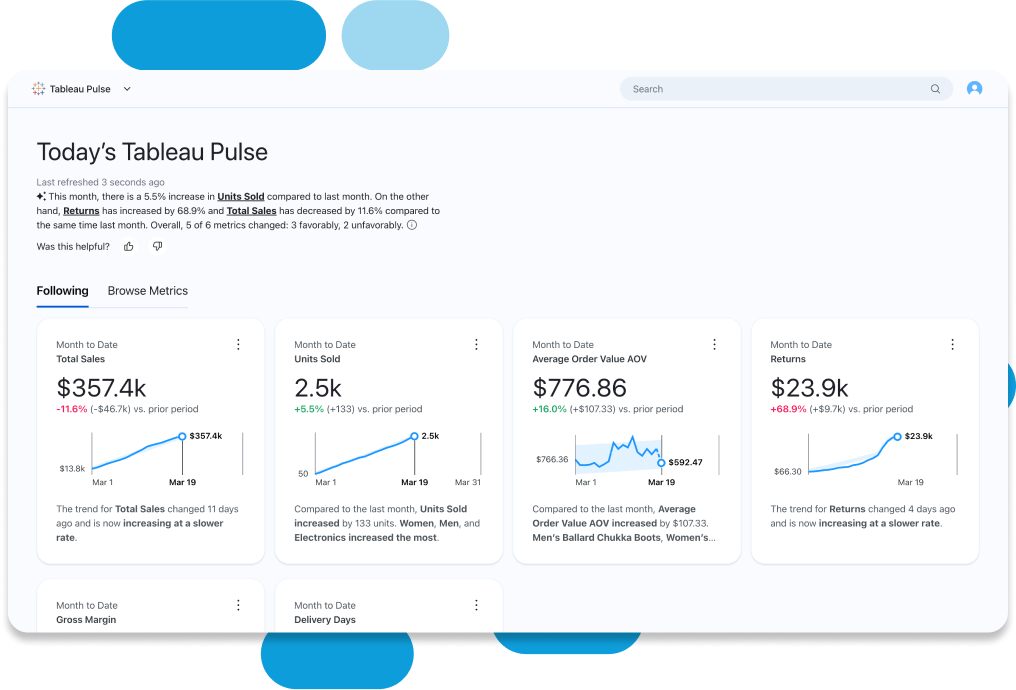
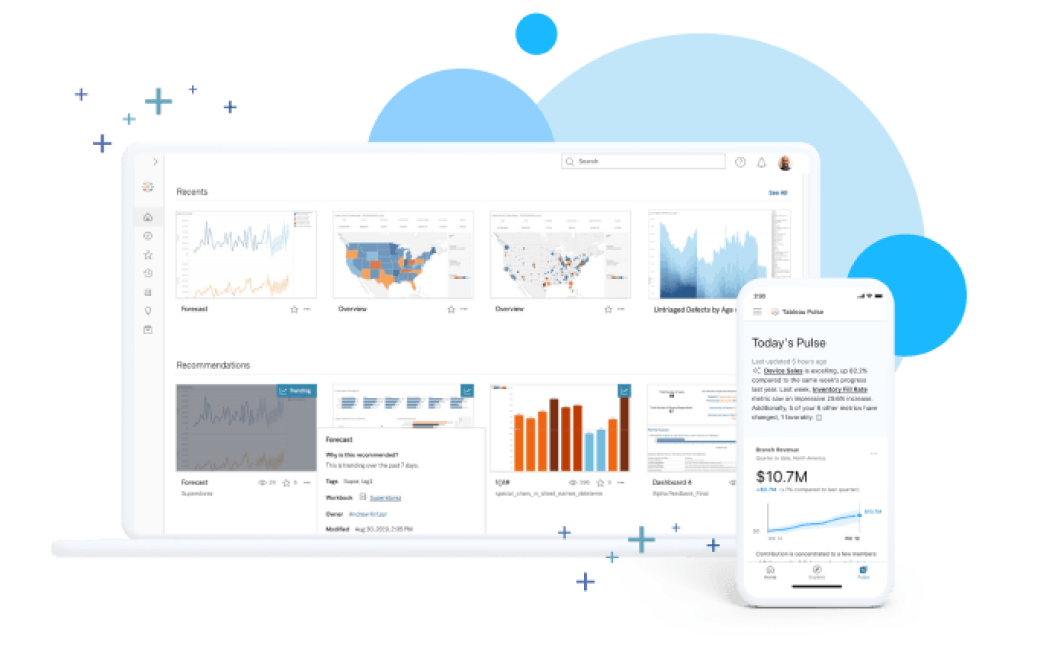
Esperienze intuitive con i dati per tutti
Scopri l'esplorazione dei dati in modo semplice, con le informazioni di Einstein integrate, per prendere decisioni migliori. Con la rappresentazione visiva a colpo d'occhio dei tuoi dati e con l'automazione integrata, Tableau arricchisce automaticamente i dati oggetto di analisi con il contesto e con il significato usati in azienda, aiutandoti a scoprire e comprendere le informazioni correlate. VizQL rende facilissima l'esplorazione dei dati, con le operazioni drag-and-drop. Velocizza l'analisi introducendo nelle dashboard elementi narrativi automatizzati facilmente e comprensibili, utilizza il linguaggio naturale per esplorare e rispondere alle domande aziendali fondamentali, personalizza le metriche con Tableau Pulse.
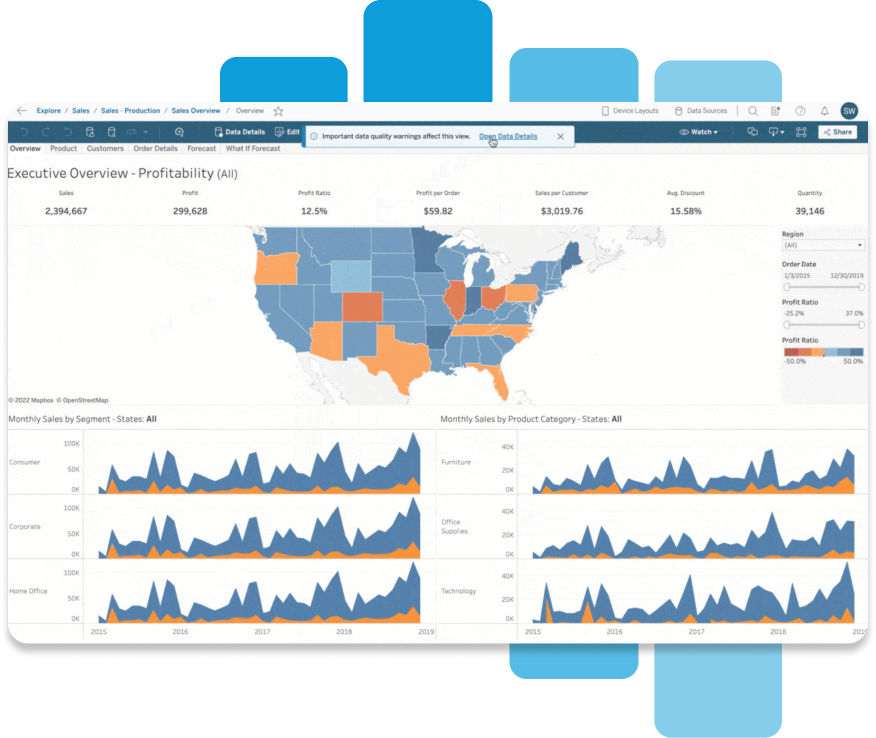
Fiducia e sicurezza in tutti i tuoi dati
Rendi disponibili dati sicuri e affidabili lì dove sono necessari, garantendo visibilità, governance e controllo. Realizza l'integrazione con il protocollo Single Sign-On (SSO) o con un identity provider. Controlla l'utilizzo in un unico ambiente per garantire la conformità in modo più efficiente. Approfitta di un'infrastruttura aggiornata, con i migliori standard di certificazione di sicurezza come SOCII e ISO. Per Tableau Cloud Enterprise, Tableau+ e Tableau Server Enterprise, le funzionalità di gestione dei dati scalano dati affidabili in modo semplice e ripetibile.
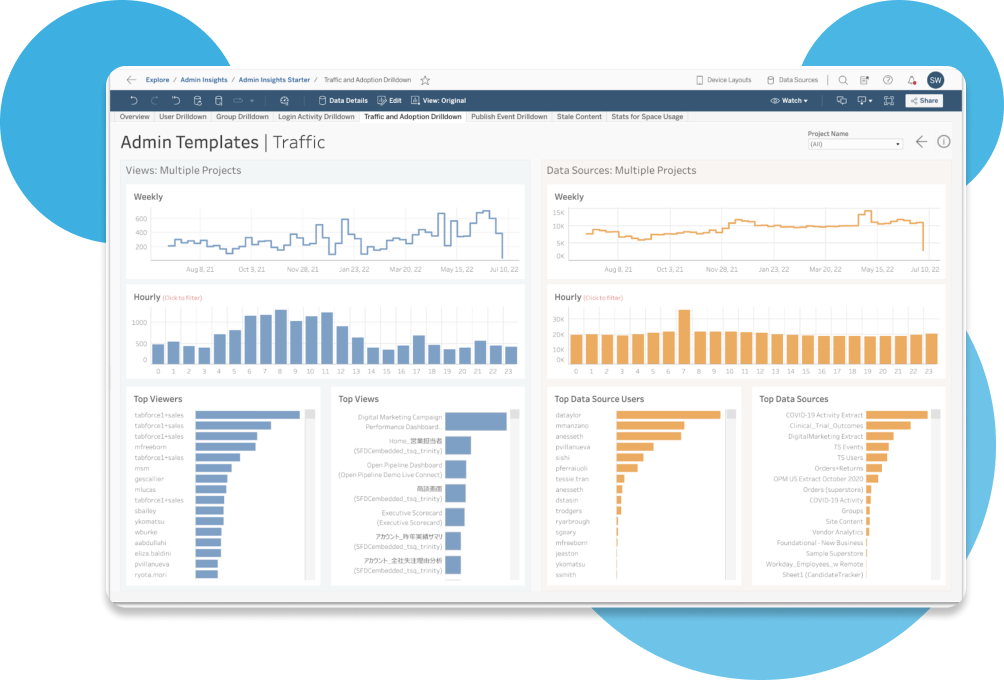
Scalabilità semplice con una piattaforma aperta e flessibile
Crea e dimensiona l'architettura dei dati nel modo che preferisci, con modelli e analisi riutilizzabili. Non sarà più necessario configurare i server, gestire gli aggiornamenti del software o estendere la capacità dell'hardware, risparmiando così tempo e denaro. Potenzia il lavoro di squadra con la possibilità di scoprire, condividere, esplorare i dati e collaborare da un dispositivo mobile, un tablet o un computer, con Tableau. Crea ed espandi facilmente l'analisi mission-critical con il pieno controllo sulle funzioni di gestione avanzata, per approfittare della scalabilità illimitata, di un'efficienza ottimale e della sicurezza semplificata. Crea una definizione standard dei dati per ricavare il massimo dalle informazioni e dall'analisi con il livello delle metriche di Tableau Pulse. Accedi alle app native per iniziare l'analisi nel modo migliore, con acceleratori, connettori, estensioni e altre risorse.
Potenzia del 33% il processo decisionale basato sulle informazioni, con Tableau.
![]()
![]()
![]()
![]()

Di pari passo con la crescita dell'organizzazione in termini di dati, aumentavano anche i requisiti e i costi; avevamo bisogno di una piattaforma in grado di crescere in base alle nostre esigenze e che fosse scalabile.

Entra nella community di Tableau
Entra in una community che ti accompagna nel tuo percorso attraverso i dati e l'analisi, ti aiuta a migliorare le competenze di visualizzazione dei dati e favorisce collaborazioni efficaci. Quando le persone sono unite dalla passione per i dati, tutto è possibile.
Partecipa ora