
EcoMarketing: Accelerating Performance with Data
Real-Time Monitoring for Immediate Response: Preventing Campaign Losses and Optimizing Performance
Identifying Key Metrics Through Repeated Analysis and Action Cycles
Real-Time Consolidation of Company-Wide Profit and Loss: Enabling Swift and Accurate Decision-Making
In a field where every second can determine millions of earned business, EcoMarketing has leveraged data to accelerate performance. By implementing real-time monitoring and optimizing key metrics through repeated analysis and action cycles, they have achieved significant improvements in campaign performance and company-wide decision-making. Here’s how EcoMarketing, a leading performance marketing company, has sharpened its competitive edge with Tableau Cloud.
A Performance Marketing Leader Driven by Data
EcoMarketing, listed on KOSDAQ in 2016, is a leading performance marketing company in South Korea with a market capitalization of approximately 430 billion won. As a pioneer in performance marketing, they have maintained the top position among independent agencies, excluding those affiliated with large corporations.
EcoMarketing's success is not just about managing ads. They have also built a strong identity as a "business boosting specialist" by explosively growing various brands such as Andar, Klug, Gamtanbra, and Easydew.
Given that they work with major apps used by the entire population, building a data infrastructure capable of handling and analyzing vast amounts of traffic data in real-time was essential for survival. While machine learning technology has made it possible for anyone to achieve some level of performance, EcoMarketing has consistently aimed for "the best performance" and "excellent results." The secret lies in their environment, which allows for deep and thorough data analysis.
EcoMarketing has extensive experience with data collection, processing, and analysis over the past decade using Tableau. Here, we introduce three significant examples of their data-driven innovation.
Case 1: Real-Time Monitoring Dashboard - Essential for Immediate Response in Marketing
Challenge: Rapidly Changing Data and Difficulty in Immediate Response
In performance marketing, real-time data monitoring is not an option but a necessity. During promotions or budget expansions, millions of won can be spent in an hour. If a landing page error or a sudden drop in media performance is detected even a few minutes late, it can lead to substantial losses. This was particularly challenging during weekends and holidays when budgets could be overspent or underutilized without immediate action.
Solution: Real-Time Monitoring System with 10-15 Minute Updates
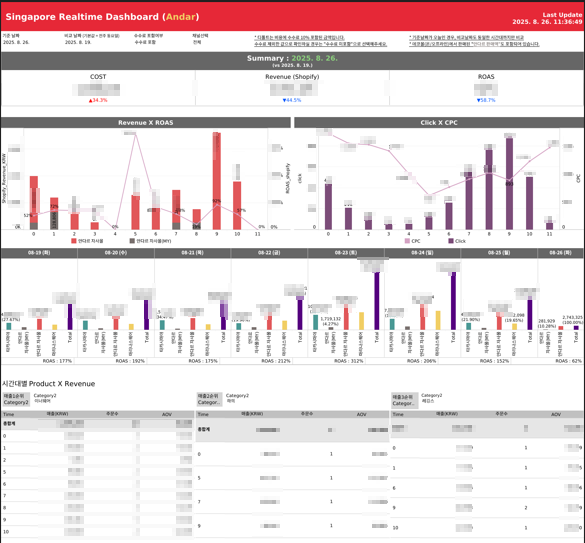
EcoMarketing built a real-time monitoring dashboard using Tableau, allowing marketers to check campaign performance at a glance, anytime and anywhere. This dashboard serves as a navigation system, providing real-time traffic conditions.
- Robust Data Pipeline: To handle large volumes of data, they adopted a Databricks infrastructure based on Spark and utilized the 'Tableau Extract Refresh' feature to minimize server load while ensuring fast load times.
- Service Scope for Cost Efficiency: Through internal user surveys, they determined that the optimal time unit for marketers to check data and take action was 10-15 minutes, setting a cost-efficient data update cycle.
- Enhanced Mobile Accessibility: By actively using the Tableau mobile app, they created an environment where marketers can monitor performance and respond immediately, even outside the office during weekends and holidays.
Outcome: 2,000 Daily Views, 93% User Adoption
Each marketer checks the dashboard an average of 17 times a day, and immediate response to every second of change to optimize performance has become routine.
The real-time dashboard has become a standard tool at EcoMarketing. With a 93% active user rate and an average of 2,000 daily views, it is clear that marketers check the dashboard at least once or twice every hour. In the office, it's common to see many marketers keeping Tableau open on one of their monitors to monitor performance in real-time. For new hires, setting up the real-time dashboard is now a basic standard.
[Example of an EcoMarketing Dashboard]
Case 2: In-Depth Analysis Dashboard - Creating Real Value Through Analysis and Action Cycles
Challenge: Gap Between Field Questions and Data Analysis
EcoMarketing not only manages ads but also operates brands like Andar. The types and depth of data they handle are different. Agency data is relatively intuitive and lightweight, while brand data is extensive and deep, covering everything from product planning to customer CRM.
Field departments often needed immediate answers to specific questions like "What products are frequently sold with Product A?" but had to wait for the data team to conduct the analysis, which was time-consuming. EcoMarketers, however, do not wait. Instead, they would download data and manually analyze it to find the necessary information, a highly inefficient process.
Solution: A Dashboard Development Process Focused on Finding 'Real Problems'
To address this, EcoMarketing innovated their dashboard introduction process. Instead of simply creating dashboards based on field requests, they focused on identifying "valid metrics that can actually drive performance."
- Repetitive Analysis and Action Cycles: When a request comes in, the data team first conducts a deep, one-time analysis based on various hypotheses. They then work with the field team to execute actions and refine the requirements based on the lessons learned.
- Building Dashboards After Identifying Key Metrics: After several cycles of analysis and action, they build in-depth analysis dashboards that clearly contribute to business performance.
- Sophisticated Visualization with Tableau: They used Tableau's various visualization and analysis features to make complex results, such as cross-selling product analysis and customer purchase pattern analysis, easily understandable and actionable.
Outcome: Connecting Data to Business Performance
This approach has directly contributed to marketers creating business performance based on dashboard insights.
- E-commerce Marketing Managers: They plan more effective bundle products and design product-specific promotions by analyzing overall cross-selling trends.
- CRM Managers: They select targets for CRM message sending and design re-purchase campaigns, contributing to a certain level of increased re-purchase rates.
- Site UX Managers: They continuously improve product detail pages by comparing their effectiveness and ultimately increase conversion rates.
[Example of an In-Depth Analysis Dashboard]
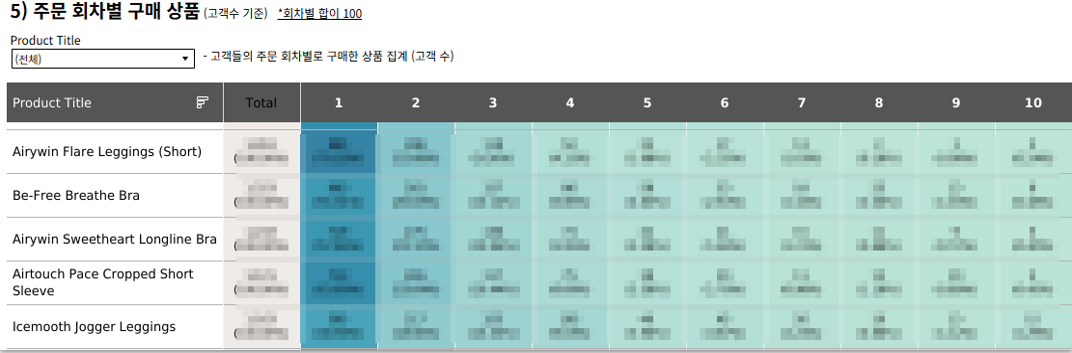
Tableau played a crucial role in creating such in-depth and sophisticated dashboards. While the data engineering process to create a dataset for deep analysis is very important, effectively presenting the results and making the analysis more useful would have been difficult without Tableau.
Case 3: Integrated Business Performance Dashboard - Aligning the Company's Focus for Faster and More Accurate Decisions
Challenge: Dispersed Standards, Slow and Inaccurate Reporting
Managing a company's revenue, costs, and profits comprehensively is a fundamental yet challenging task. Previously, each department compiled data based on different standards, leading to low data reliability and a long time for C-Level leaders to grasp the overall business status. For example, the criteria for calculating 'refund rates' varied by brand, making accurate comparative analysis impossible.
Solution: Daily Profit and Loss Dashboard Based on Integrated Company-Wide Datasets
To solve this, EcoMarketing, under the strong leadership of C-Level, established company-wide data governance. They developed a consistent and integrated dataset and built an integrated business performance dashboard based on this.
- Result: They can now check the company-wide profit and loss status on a daily basis. This dashboard consolidates the performance of all brands and countries in a unified standard, enabling clear comparative analysis. Additionally, it goes beyond just showing data by allowing detailed analysis at various levels, including periods, brands, countries, product categories, promotions, and channels.
Outcome: Revolutionizing C-Level Decision-Making Speed
Now, EcoMarketing's leaders check the company-wide profit and loss status every morning using the Tableau dashboard. This provides a critical basis for making faster and more accurate decisions, such as investments and returns.
All executives start their mornings by checking the company-wide profit and loss status on the Tableau dashboard.
The Future of Data Democratization with AI Innovation
EcoMarketing's data innovation journey does not stop here. So-min Park, the leader, believes that "true data democratization is possible by integrating AI into data" and is preparing for the next phase of innovation through AI.
Their goal is to create an environment where everyone can access deep and comprehensive insights without limitations, focusing on developing AI services that users can effectively utilize.
The collaboration between EcoMarketing and Tableau has gone beyond mere system adoption, transforming the data utilization paradigm in the performance marketing industry. In a highly competitive environment where every second can determine performance, EcoMarketing's ongoing challenge to use data as a weapon for sustainable growth continues.