How to Use the Intersects() Calculation in Tableau


When analyzing location data, you often want to know about what is inside a given boundary. While Tableau’s spatial intersection join lets you look at all possible combinations of locations across multiple data sources, sometimes your question is quicker and more personal - just tell me about what is near this one location right here! We've introduced a new calculation called Intersects() that you can use to perform a lightweight version of the spatial intersection join directly on the worksheet.
Let’s take a look at a few great analytics scenarios that the Intersects() calculation unlocks.
What is near this point of interest?
When you want to look at values for one point of interest (POI) at a time, Intersects() makes it easy to dynamically evaluate what is near your specific POI. Adding a parameter action lets you change the POI on the fly with dynamic updates for all of your local analytics.
Here is an example of allowing a user to dynamically select a school, generate a variable size buffer around the school centroid using Tableau’s Buffer() calculation, and then use Intersects() to identify other schools within the buffer distance. This dashboard will update the analyses for any school that the user selects, without having to do complex setup work with spatial joins between all possible combinations of data sources. To see how this was done, check out the workbook on Tableau Public!

What is near this point of interest - across data sources?
The example above looked at relationships within a single data source - find all schools that are near to another school. But, what if you want to know about relationships between data sources? For instance, maybe we want to know about all of the buildings that are near one of the many schools in Washington DC. We could join a data source with DC schools locations to our dataset of Building footprint locations, but we could also just store the latitude and longitude of the selected schools in parameters and let those “talk to” the points in our buildings data source. A parameter can be accessed by any data source in the workbook, so we can pass the latitude and longitude for a school selected in our DC School data source over to the DC Buildings data source, then create a buffer and use Intersects() to find all of the buildings within our user-specified distance.
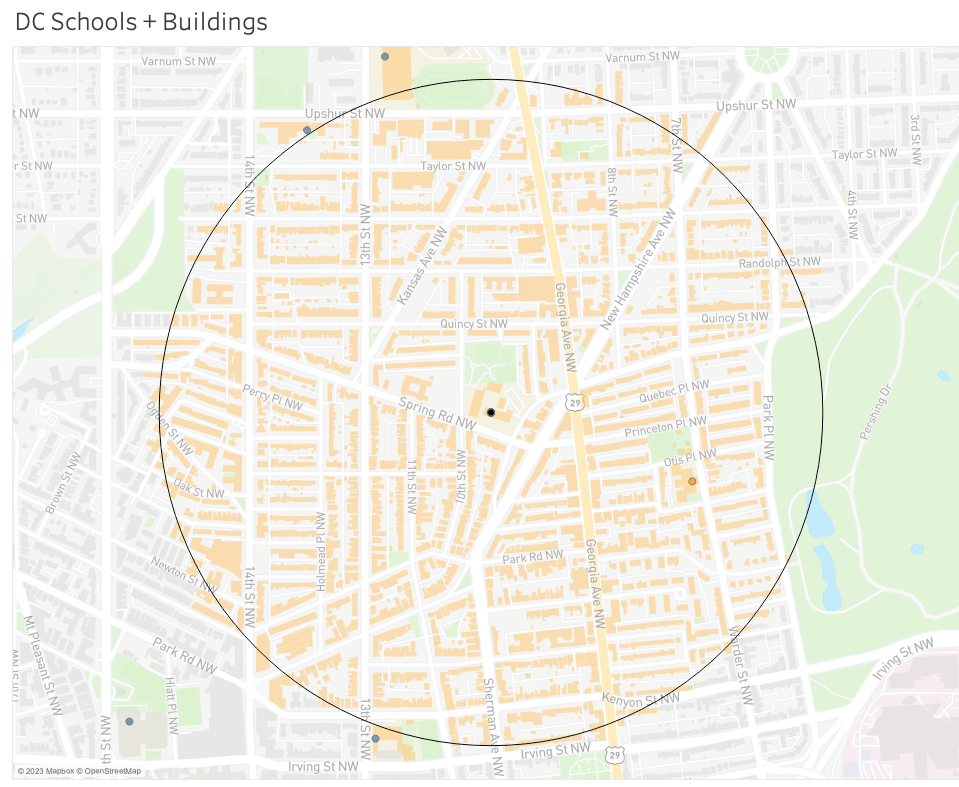
To see how this was done, check out the workbook on Tableau Public, or follow these steps:
1. Create parameters (Latitude, longitude, and a list of schools) that bridge the entire workbook
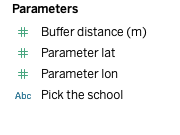
2. Public Schools dataset: Use MAKEPOINT() to plot school locations
3. Buildings dataset: Create a Geometry to copy School locations using Parameter actions on the Dashboard. This is needed to build the BUFFER().
4. BUFFER() the Buildings based on a parameterized distance
5. Use INTERSECTS() to find which Buildings are within the buffer distance of selected School
In this dashboard, you will create the following:
How do my values compare to adjacent locations?
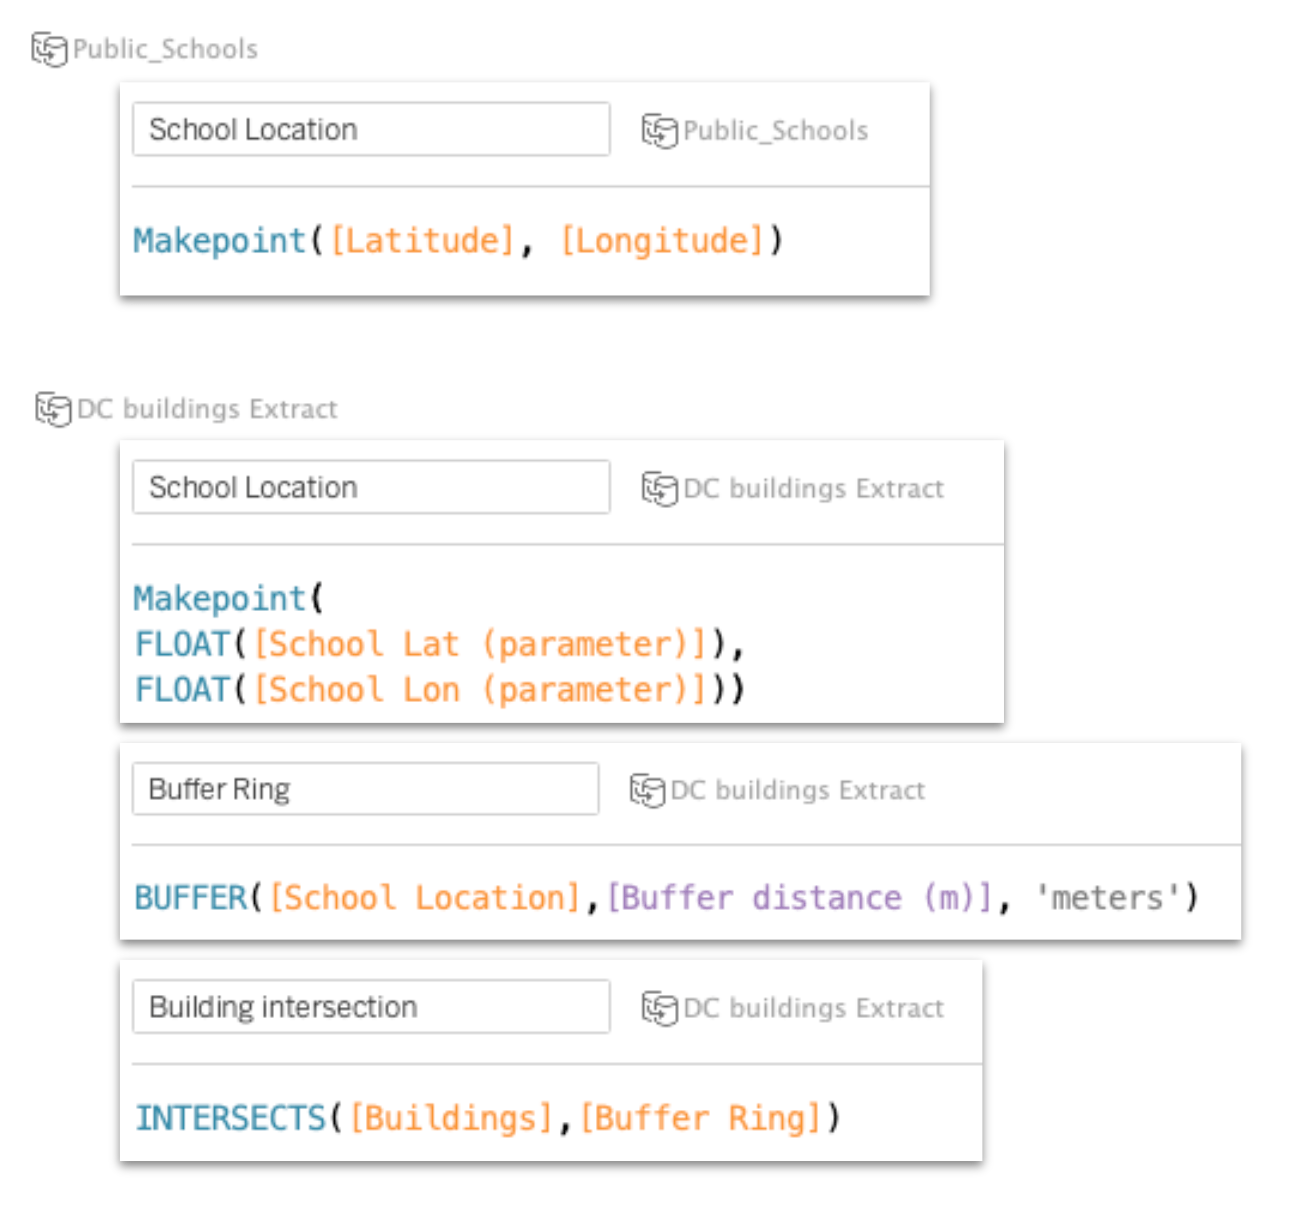
Comparing a location’s value to the direct neighbors can provide an interesting contextual data point. Are the values for this location much higher or lower than the surrounding region? For polygons, like counties, how can we find these neighbors? We can use a parameter action and Intersects() calculation to drive analyses of the neighborhood for a selected location!
For instance, let’s compare the land acreage of a selected property to the area of all of its neighboring properties. In the image below, we can see this property in Hardy County, WV is not larger than all of the surrounding properties (bar chart, right of map), but is bigger than the average size of the properties surrounding it. All of the neighboring properties counties combined have a larger acreage (right stacked bar chart). There are many ways to calculate comparison metrics, these are just two examples to demonstrate. To see how this was done, check out the workbook on Tableau Public!
Validate spatial attributes
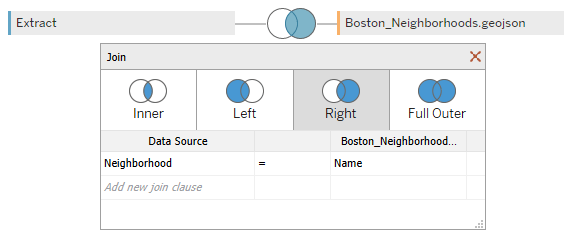
Some data sources have attributes listing the name for related geographies, but sometimes the data location and the name don’t agree. Intersects() can be used to visually validate! For instance, the City of Boston provides details on 311 service requests through its open data portal. Along with a latitude and longitude for the 311 request, they also include attributes that align with geographies like neighborhood, police district, etc. But, location data isn’t always clean and it can help to do a sanity check to make sure these attributes were assigned correctly. In this case, I have joined a 311 service request dataset with a polygon file with neighborhood boundaries. The join is based on the neighborhood name - it is not a spatial join.
Using Intersects() on the worksheet, I can then look at how many points are correctly attributed to the right neighborhood… and, more importantly, which ones are incorrect. That lets me problem-solve and go back to clean up my data, or to know which records might be suspect to use for other analyses.
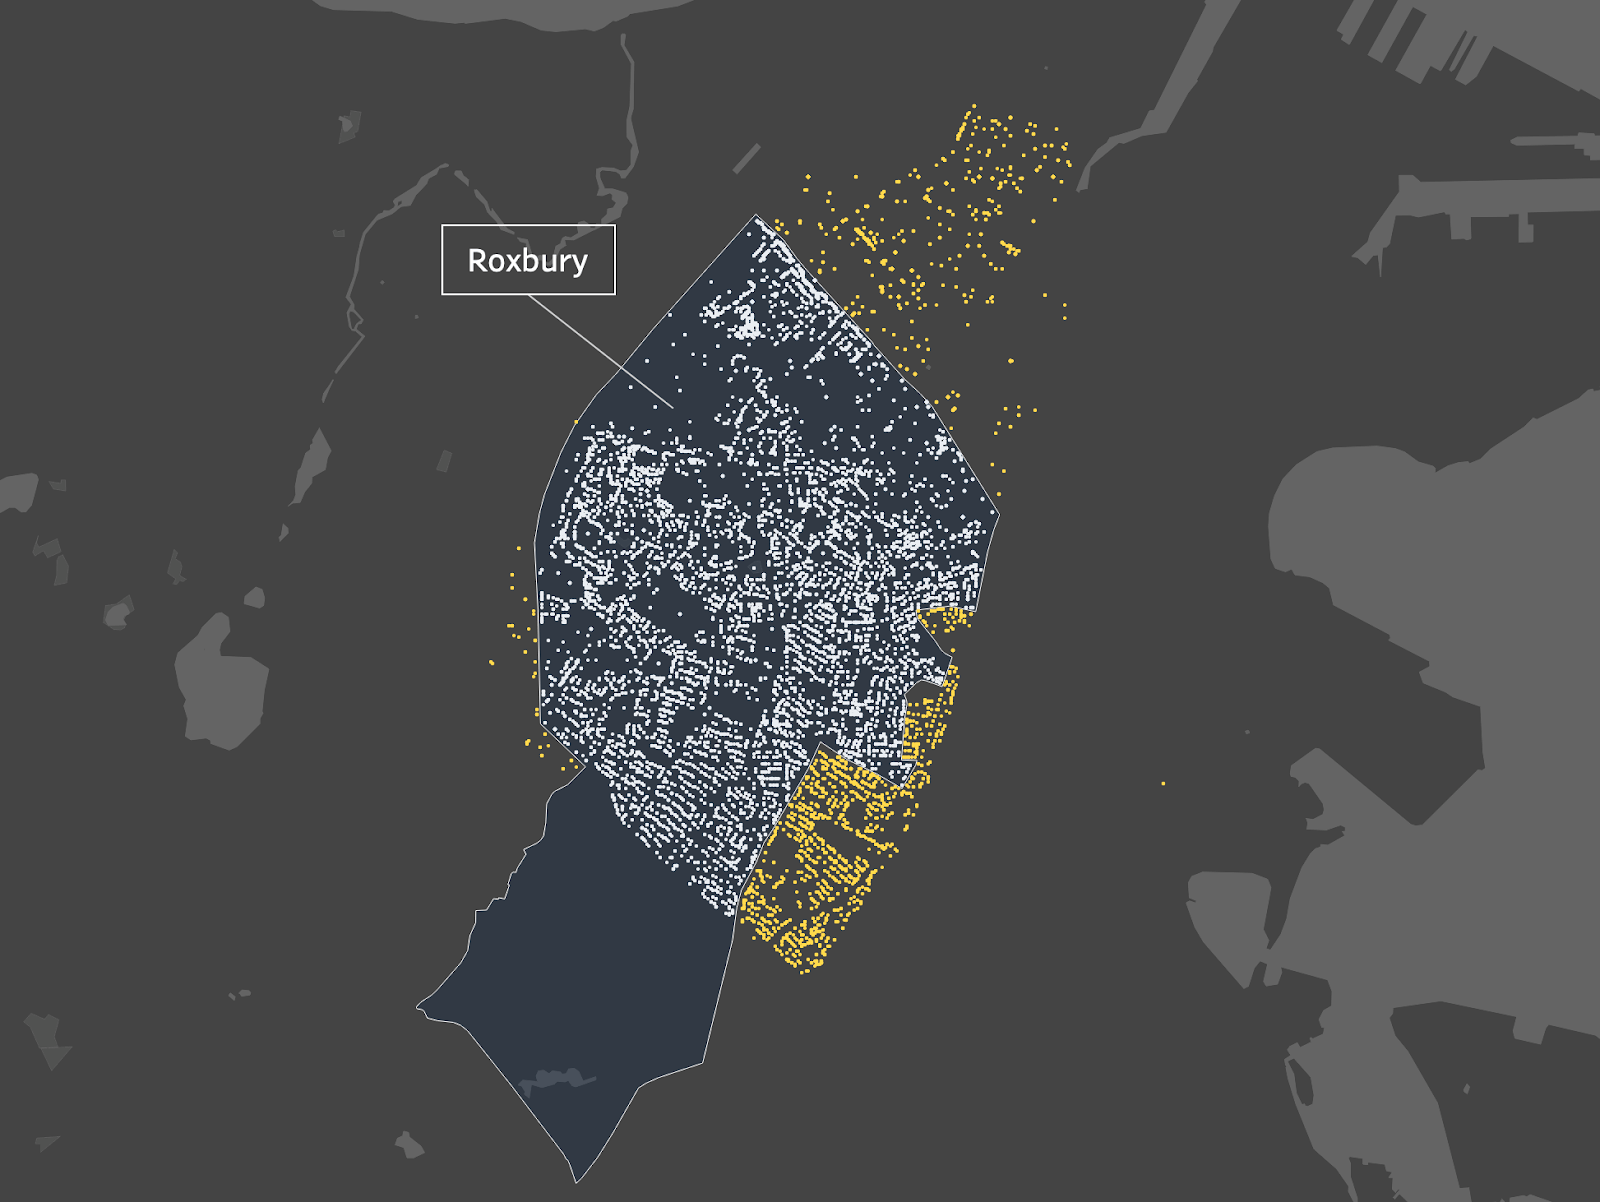
For instance, here are all of the points labeled as being in ‘Roxbury.’ While the neighborhood boundary file also came from the City of Boston’s open data portal, the boundary definitions don’t seem to match up. Some of these might be related to a change in boundary definition over time, or based on the fuzziness of human interpretation of “neighborhood” boundaries, and some may be due to errors in the coordinates (e.g., the points farther away in the Financial District). The white dots are locations within ‘Roxbury’ while the yellow dots are locations labeled ‘Roxbury’ but are actually adjacent or close neighborhoods. To see how this was done, check out the workbook on Tableau Public!
Tableau’s mission has always been about answering data questions. Over the years organic spatial capabilities have been added to answer contextually spatial questions. Tableau’s Spatial join, released in 2018 was one of the biggest steps in that progression. With this recent addition, the Intersects calculation allows you to ask quick and dynamic questions at the workbook level.
Autres sujets pertinents

5 Ways to Use Tableau Public to Achieve Your Goals
 11 janvier, 2025

World Mental Health Day: Elevating Awareness Through Data Visualization
 10 octobre, 2024

From TV Screens to Tableau: Visualize Your Favorite Shows with IMDb
 31 août, 2024