Management is able to make quick decisions to drive business outcomes
Micro and macro trends can be understood within seconds, while previously the business needed hours and days for data analysis
400+ Tableau users within the organization who are data literate and building a growing data culture
DFI Retail Group is a leading pan-Asian retailer which operates over 10,000 outlets, including grocery stores, convenience stores, health and beauty stores, and home furnishings stores.
In 2019, DFI Retail Group turned to Tableau for an effective way to analyze the performance of its stores. In order to drive consistency and performance across stores, there is a need to measure performance for each store. It became too difficult to track and analyze all these within spreadsheets. Extracting insights took hours and days and required expertise using spreadsheet formulas. The size of data sets was also an issue and meant that files sometimes failed to load.
Seeking an alternative to spreadsheets, DFI Retail Group chose Tableau because it would allow employees to visualize and interact with their data and reduce the time spent on data analysis. It was also user friendly, meaning that employees could get started with Tableau relatively quickly.
“Based on our evaluation of different options, Tableau was the best fit for our needs due to cost, performance, and ease of use for end-users,” said Eu Kwang Chin, IT Director at DFI Retail Group.
Establishing data literacy
For DFI Retail Group, there were three key components in building a strong DATA CULTURE. The first was support from management which included investment in the right technology as well as investment in time for employees to build and learn new skills. The second was an open-minded approach from business users who readily embraced opportunities to apply data insights to their daily activities. Finally, there was a team of “bridge builders” who helped to drive training and other enablement activities within DFI Retail Group.
Enablement activities included fortnightly Fast Start Workshops to bring new users onto Tableau. DFI Retail Group then held more frequent Advanced Workshops to enable power users.
To further support adoption, DFI Retail Group established templates for routine reporting and analysis. They also participated in a Tableau Data Doctor session where they had the opportunity to seek help with specific problems. This led to enhancements like faster load time for dashboards, helping DFI Retail Group optimize its use of Tableau.
DFI Retail Group was supported in its adoption journey by Tableau’s Customer Success team. The team helped to orchestrate enablement activities based on the Tableau Blueprint which offers a step-by-step guide to becoming a data-driven organization. Tableau is now firmly embedded into the business, with adoption growing from 56 users to more than 400 in just over six months.
Automating and visualizing insights
DFI Retail Group now has automated dashboards to analyze trading activities across markets, including sales and profit. The dashboards have reduced time spent on routine reporting and equipped employees to focus on more value added work, including business strategy and interactions with stakeholders.
Employees can also drill down into the data in just a few clicks and get a comprehensive view of how each store, department, category, and even product is performing.
“Everyone in the team can now access the same insights, from anywhere, at any time. It helps team members to better prepare for their meetings with stakeholders and also allows management to pinpoint issues or opportunities and react quickly with a consistent set of numbers,” said Eu Kwang Chin.
DFI Retail Group credits the visualization capabilities of Tableau for helping it quickly tackle business problems. For example, when analyzing decreases in sales performance for a particular store, business metrics can be presented in a way to easily show which categories or brands have contributed to the change. Outliers or anomalies in the data can also be highlighted.
Everyone in the team can now access the same insights, from anywhere, at any time. It helps team members to better prepare for their meetings with stakeholders and also allows management to pinpoint issues or opportunities and react quickly with a consistent set of numbers.
Driving brand success
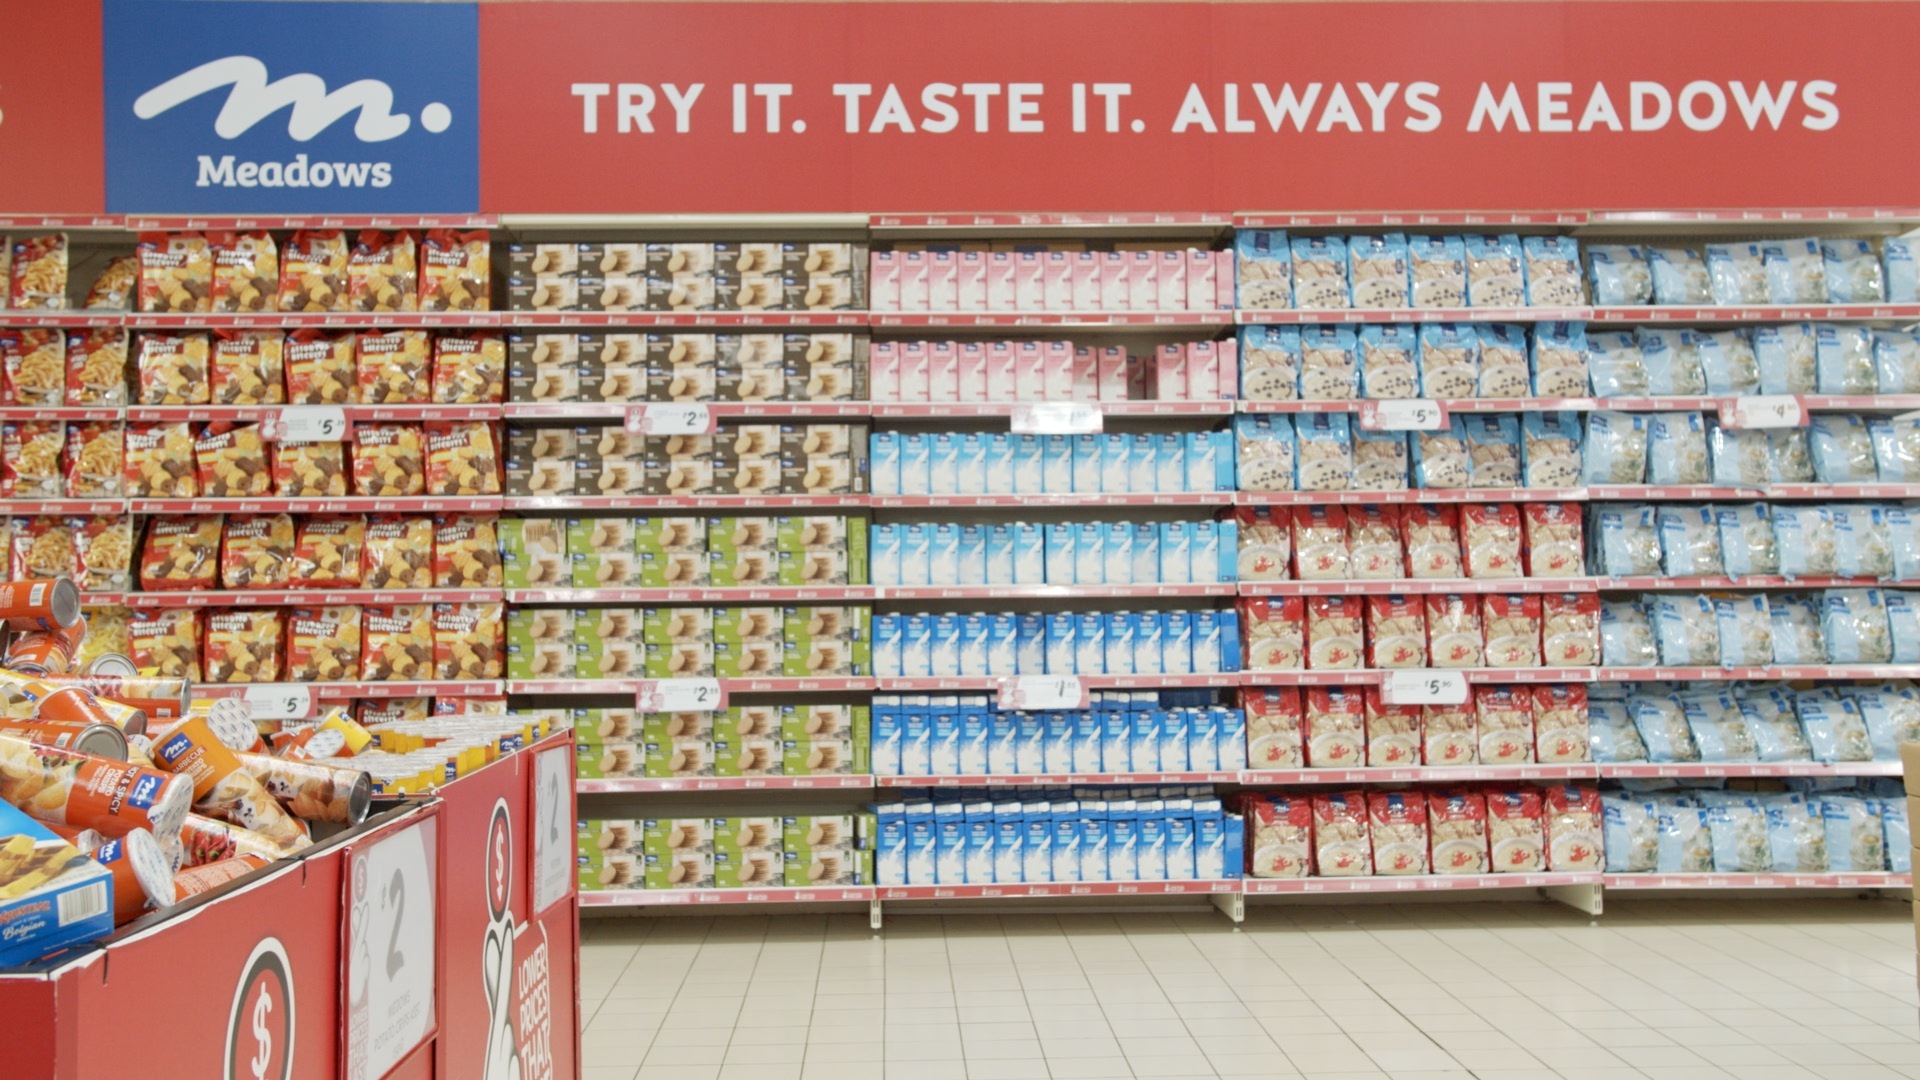
In 2020, DFI Retail Group launched its own brand of products to sell in its grocery and convenience stores. The brand, known as Meadows offers great value to customers with high quality products at extremely competitive low prices.
DFI Retail Group is using Tableau to provide visibility of business performance, thereby driving penetration of this brand to provide more value to customers. The dashboards are highly visual with good use of charts and colours so that it is easy to identify call outs and discussion points.
For example, management can easily see drop in penetration rate from one month to the next. They can then drill down into the underlying data in a few clicks to understand the contributing factors. These insights ultimately enable them to quickly adjust pricing or make other decisions to get sales and profits back on track.
DFI Retail Group’s adoption journey with Tableau has been positive and it continues to see strong momentum with new users coming on board and adding data literacy to their skillsets. There is also increasing consolidation and standardization of business performance dashboards across the group. Management and team members also have increasing visibility of business performance, with less reliance on external consultants.
“In the past, there’s always challenges to get the right data, organize them, and then putting in reports for analysis at speed. Business has struggled with getting the right insights timely. With Tableau, we can build fit for purpose dashboard/report visualization solutions that enable teams to perform. Digitalization is already accelerated due to COVID-19, and data platforms such as Tableau enables a data-driven way of working that allows us to adapt, adjust, and respond to a rapidly changing market,” said Eu Kwang Chin.