Patent Information Promotion Center unleashes statistical data in Tableau
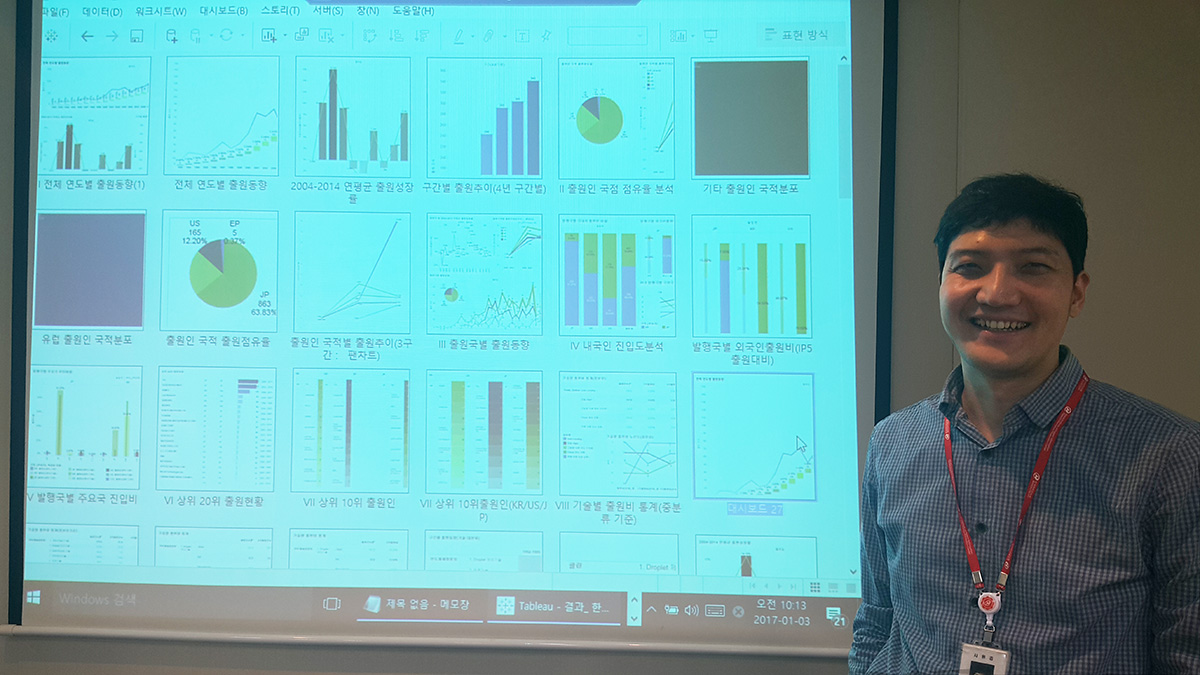
Dr. Jea-tek Ryu, Senior Researcher on the intellectual property analysis team.
To address resource constraints, PIPC adopted Tableau Desktop and Tableau Server. In Tableau Desktop, analysts can easily recreate analyses for customers instead of starting from scratch with every new request. Analysts leverage R in Tableau, pulling data from Microsoft Access, SQL Server, and Excel. With Tableau Server, PIPC shares data with customers in a secure environment. Increasing data quality with visual analytics ultimately helped increase productivity among PIPC employees. For an average of 15 reports, this process reduced reporting time from 12 hours to 5 minutes. With Tableau, PIPC has streamlined their workflow, with more room to explore new ideas and test hypotheses with a few clicks.
Increased demand, limited resources
In 2013, the number of patent applications around the world was 2,568,000. In the same year, Korea was ranked as the world's number one in resident patent applications per GDP $100 billion and per million population. A core element that drives a company’s valuation is its intellectual property rights. In research and development, companies collect technical data of similar or competing products and analyze domestic and overseas patent information. As important business decisions hang on these analyses, accuracy is crucial. Patent Information Promotion Center (PIPC) is a public organization that provides patent information and supports policies of the Korean Intellectual Property Office. PIPC’s consulting division analyzes patent data to guide their customers in the right direction. As part of this process, PIPC researches worldwide patent documentation to help the customer understand the competitive landscape and important statistics related to the customer’s specific technology. For existing data, PIPC's analysts used Excel for both analysis and visualization—an incredibly manual, time-consuming process. It took at least half a day to create 10 to 15 reports and up to a day to distribute the final versions. And each new request required analysts to once again cycle through the manual process. Acquiring data was increasingly difficult—making it harder to produce high-quality reports for customers. PIPC’s standard process couldn't meet ever-increasing customer needs for higher-quality, deeper statistical analyses. With restricted IT resources, PIPC needed a self-service solution built on governed data. And they needed to be able to securely share this data across the company. In addition, PIPC’s consulting division wanted to work more collaboratively with customers around patent consulting reports. To enhance customers’ understanding, PIPC needed to make their analysis reports more intuitive with visual analytics. To address this challenge, PIPC started to search for a new approach to analysis.
Tableau allowed us to dramatically reduce the time for repetitive, time-consuming work that was done using Excel, from 12 hours to 5 minutes. Data scientists can create high-quality reports because they can focus on accuracy and consistency without having to intervene in all analysis steps.
Finding a better solution
PIPC decided to adopt a business intelligence (BI) solution to better serve customers. PIPC reviewed around 20 BI solutions available in the market before deciding on Tableau. Compared with other BI solutions, Tableau Desktop allowed PIPC’s analysts to notice patterns in the data and visualize them easily. It also implemented powerful statistical calculations with a simple drag and drop—encouraging data discovery. During their trial period, PIPC evaluated Tableau for data exploration, rich analysis, and the ability to share data both internally and externally. Another major criteria for PIPC was ease of use. They needed a tool that was both easy to adopt and enjoyable for customers to use. They found that Tableau fit all of these requirements. Dr. Jea-tek Ryu, Senior Researcher, IP analysis team at PIPC said, "We chose Tableau Desktop and Tableau Server so that our analysts can analyze various data, including third party data. When demonstrating Tableau, we raised work efficiency and productivity by largely reducing the time to analyze numerous data sources. Today, most of our time is only spent on data updates." Today, PIPC conducts analysis in Tableau Desktop, sharing final workbooks with customers over Tableau Server. PIPC analysts leverage R in Tableau, pulling data from Microsoft Access, JSON files, SQL Server, and Excel. With Tableau, PIPC has the option to connect to data both on-premises or in the cloud.
[With] Tableau, we raised work efficiency and productivity by largely reducing the time it takes to analyze numerous data sources."
Reducing labor time from 12 hours to 5 minutes—with richer analytics
Today, analysts don’t have to rebuild reports for every request. They publish a set of reports for each department over Tableau Server, allowing business users to drill down deeper and conduct their own analyses. As a result, PIPC reduced average labor time around reporting by more than 90%—from 12 hours to 5 minutes. When PIPC’s analysts need to adapt a workbook, they simply tweak it instead of rebuilding the entire report. This fosters more efficient analytics processes across the entire business. Previously, PIPC analysts had a hard time ensuring data quality within their reports. Today, they can easily spot data concerns before starting their analysis. Internal users can now create their own visualizations, built on accurate data. With reduced labor and resources, employees now have time to focus on more strategic projects. They can also process more customer demands, creating more room for expanded business opportunities. With Tableau Desktop, PIPC’s analysts can achieve rich analytical depth with a few clicks of the mouse. And with Tableau’s R integration, they can easily visualize statistical data. Analysts can now answers questions in their data at the speed of thought, allowing them to explore questions as they arise. This enables rich data storytelling. In Tableau Server, users can now access Tableau on their mobile devices, through PIPC’s web portal, giving consultants added flexibility on the go. Before Tableau, analytics were restricted to technical roles. Today, data scientists curate data sources for self-service discovery across PIPC. This results in time savings, higher quality reporting, and deeper analytical capabilities across the board. Check out this on-demand webinar to learn more how PIPC is using Tableau.