Nanyang Polytechnic students get hands-on data analytics experience with Tableau
Diploma courses, Business Intelligence & Analytics and Business Informatics—offered under Nanyang Polytechnic’s School of Information Technology—focus on providing students with data analytics skills that are required in today’s workplace. Dr. Koh Noi Sian, Lecturer at the School of Information Technology at Nanyang Polytechnic, decided to use Tableau in her classroom to teach students how to gather insights from data. Because of its easy-to-use interface, students spend less time learning the tool, and more time getting hands-on data analytics experience.
More time for actual analytics
The School of Information Technology introduced Tableau into Nanyang Polytechnic’s curriculum in 2011, when the Diploma of Business Intelligence & Analytics (DBA) was launched. When the DBA team researched self-service data analytics tools, they found that a lot of tools required a fair amount of coding. Students would have to spend more time learning the tool, leaving less time to actually work with the data. They came across Tableau and found that it was easy to use, with the analytical depth that was necessary for the curriculum. “It used to take a few weeks for students to create one dashboard,” said Dr. Koh. “They had to learn to use these complex, traditional visual analytics tools and this required quite a bit of scripting skills. We wanted to avoid this and allow the students to have more time to explore and work with data,” she explained. When Dr. Koh adopted Tableau into her curriculum, she spent an hour demonstrating Tableau to her students. After the quick training, students continue to pick-up Tableau within the first lesson, and usually create dashboards almost immediately.

Tableau for students of all levels
Currently, the analytics related modules and workshops see enrollment of up to 400 students per year. Tableau is taught in the Data Visualization module, which students take in the second year of the DBA course. They learn the key skills necessary for creating an effective dashboard. In the process, they are required to gather data from official sources like government websites, and use Tableau to analyze the data and gain insights into current topics such as housing and healthcare trends in Singapore. Students in the final year of the course use Tableau to work on real-life industry projects during their internship and they have to present to business executives and professionals at their internship company. Many of these industry partner organizations are highly impressed with the students’ presentations. Some have even adopted the use of Tableau in their own work. “Some of the more creative students are able to create very impressive charts and diagrams that are both visually appealing and informative,” said Dr. Koh with pride. “The students love Tableau. When they are given a dataset, the first tool they turn to is Tableau. They also use Tableau when they come across any data work at their internship,” she added. Dr. Koh has since helped introduce Tableau into various curriculums at her school. There are now five modules within the Business Intelligence and Analytics diploma course that includes Tableau in their course work. “I just conducted a Tableau training session for 50 colleagues from my school, and my colleagues found Tableau to be very easy to use,” commented Dr. Koh. Additionally, Nanyang offers evening classes in business and big data for working adults and holiday courses for secondary school students. The school has incorporated Tableau into these classes with great success, according to Dr. Koh.

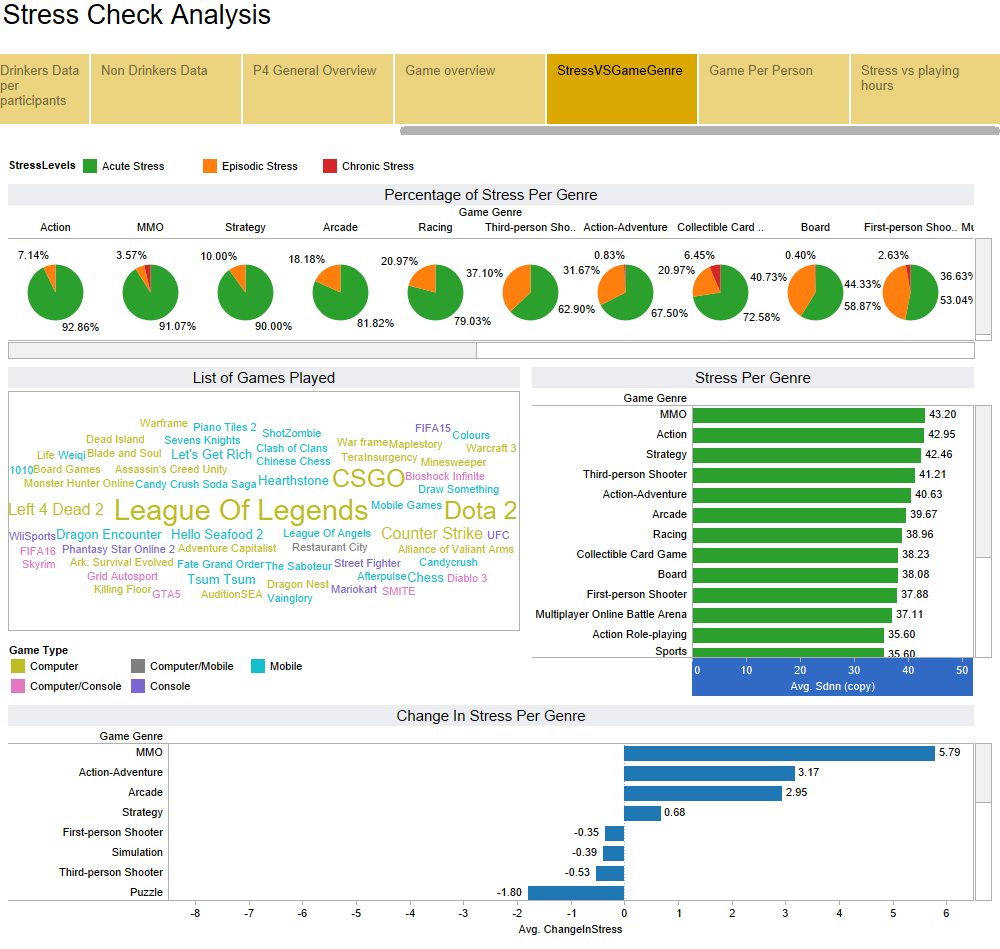
Students in the Data Visualization module analyze data that interests them. For example, students analyze percentage of stress in gaming genres.
Training the trainers on Tableau
Dr. Koh’s colleagues from other schools within Nanyang Polytechnic have also approached her for advice on introducing Tableau into their curriculum. She is planning to conduct an institution-wide training session to help lecturers from the other schools get familiarized with the software. Dr. Koh said, “Data analytics is increasingly becoming an important skillset in the workplace. The first batch of students who were taught Tableau in their coursework here have told us that working with Tableau is one of the most important skills they have learnt as they have been able to apply the skill to their work in the industry, and also in university projects for those who went on to university.” Finally, she shared that Tableau has moved beyond a teaching tool at Nanyang. Many of her colleagues have also started to use Tableau to track students’ performance, enrollment numbers, and even student stress levels by analyzing data from wearable fitness devices.