Jakarta Smart City visualizes solutions to urban challenges
60 visualisations created for government agencies
40 public visualizations, providing transparency to citizens
Up to 70% savings in the time to produce dashboards
Jakarta Smart City is a local government initiative dedicated to optimizing the use of technology to solve complex challenges such as pollution as well as emerging concerns like COVID-19. Data is key to tackling these issues and that’s why Jakarta Smart City has a Data & Analytics division whose role is to help the government make better decisions, faster.
In its early days of operation, much of Jakarta Smart City’s data was analyzed in spreadsheets, with charts and graphs copied and pasted into presentations. The Data & Analytics division moved to Tableau four years ago to get insights faster and present them in a more engaging way. The division now has 50 active Tableau users and they are able to create dashboards in days instead of the weeks it took previously. This represents a time savings of up to 70%. More importantly, Jakarta Smart City and other government agencies are able to formulate policies based on data. Through the use of Tableau, the Data & Analytics division has also been able to support government agencies with understanding and managing risk related to COVID-19.
Data-driven policy innovation
Jakarta Smart City’s Data & Analytics division has worked with government agencies to establish 60 visualizations that help address issues like pollution, traffic, and flooding. In the case of pollution and traffic, these issues are closely linked and the division first used Tableau to understand the extent of pollution based on information collected from sensors placed around Jakarta.
This data ultimately helped inform a policy that limits the number of vehicles permitted to travel into the city each day. Known as the ‘odd-even’ policy, it restricts certain roads to vehicles on certain days based on the last digit of their registration plate. The policy is intended to encourage public transport and the city continues to monitor its effectiveness by analyzing whether there are increases in public transport use or whether traffic jams are forming in new areas. This data will help to refine the policy as needed and make any necessary adjustments to public transport.
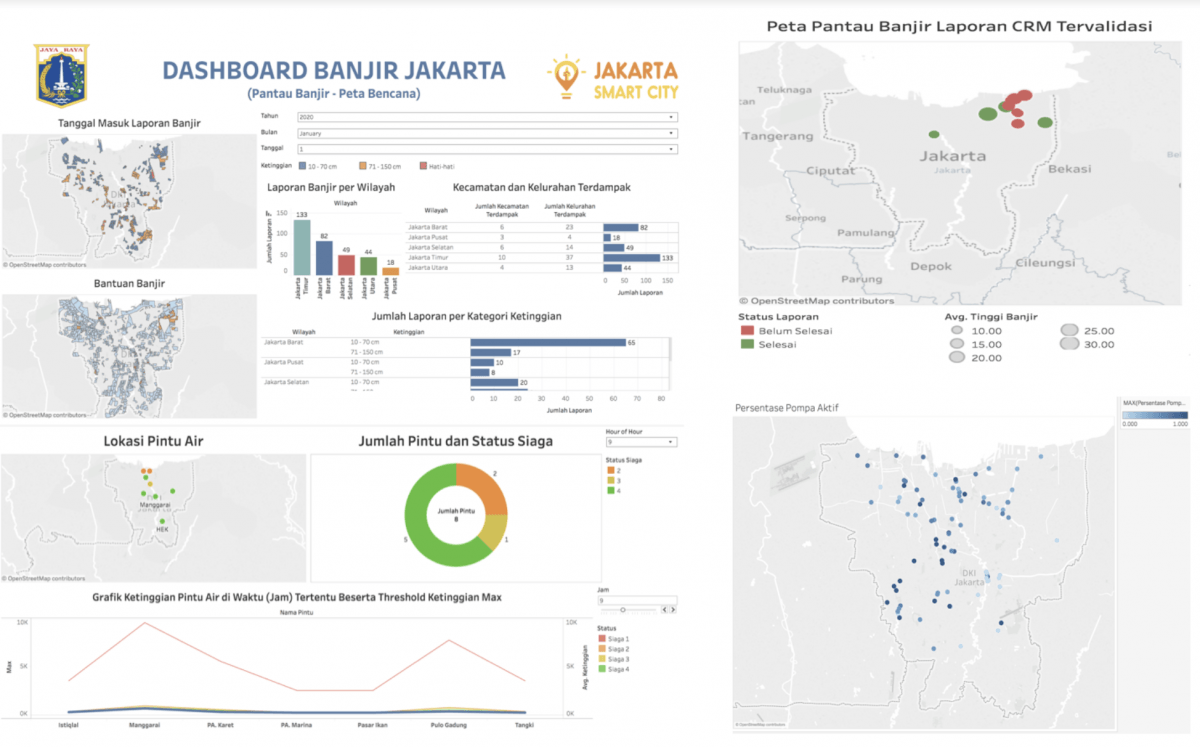
To address flooding in the city, the Data & Analytics team has set up Tableau dashboards for real-time monitoring of river and sea levels. If the water reaches a certain point, it triggers an alert that initiates a quick response from the government. Also, by analyzing and visualizing the water levels over time, the city can better understand why and when the flooding occurs and take action to manage risk.
Juan Kanggrawan, Head of Data Analytics at Jakarta Smart City, said that in addition to helping solve these and other challenges, Tableau had helped to foster a healthy culture of open data sharing. This is evident not only internally but through Jakarta’s open data project which provides public access to 40 visualizations.
Tableau democratizes analytics by making it easier for non-technical users to understand and take action on data. It is because of this that it helps us in our role to collaborate with other agencies and support them to make better decision.
Managing and responding to crisis
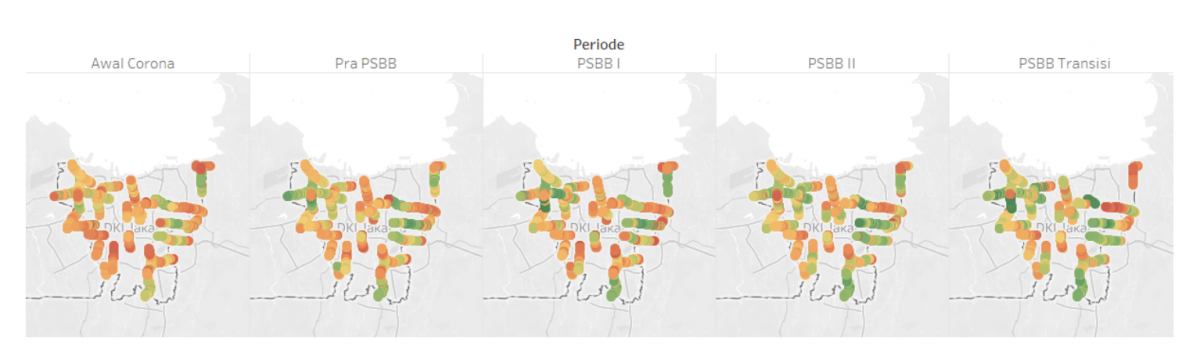
Building on is data culture, the government is using analytics to understand and manage the risk of COVID-19. The Data & Analytics division has developed Tableau visualizations to show the pattern of cases in different regions so that the government can understand the spread and prioritize its response. For example, the data can help them to see where doctors and nurses are needed and inform decisions about what social assistance may be required in different regions
The division has also created a public dashboard that provides an overview of confirmed cases in Jakarta and across Indonesia. This dashboard has been viewed by more than 2.8 million people as everyone seeks to understand the impacts and risk.
“By closely monitoring the situation and modeling the impacts, we can make better decisions like how long we need to limit our social interactions and when children should go back to school,” said Kanggrawan. “This will help us prepare for the new normal and a progressive reopening.”