
How Salesforce Built a Smarter Sales Strategy with Tableau and AI
Power 85% of Salesforce Sales teams with AI-driven data insights in near real time to focus on selling versus administrative tasks
Experience greater forecast accuracy with sophisticated what-if scenarios, adjusting forecasts on the fly
Act on opportunities faster with personalized, contextual insights delivered via Slack and Salesforce Flows
Salesforce equips its Sales team with powerful Tableau dashboards, metrics, and analytics agents to deliver relevant, AI-powered, actionable insights. Popular tools like the Forecast Walkup and “Who’s Hot?” dashboards enable dynamic forecasting, scenario planning, and lead tracking. Integrated with Salesforce and Tableau Next, these solutions are boosting productivity and empowering account executives to drive growth and customer success with actionable insights that make sales analytics a proactive, conversational, and strategic advantage.
Tableau is the tool that gives users the ability to ask questions about the data they're seeing and solve business problems faster.
The Challenge
Using data to make better decisions in an ever-shifting market
Salesforce recently decided to upgrade its dashboards to better address some of the sales analytics challenges all organizations face today: integrating multiple data sources to respond to shifting market conditions, improving contextual insight (not just what happened, but why), quickly identifying lead stages, and determining how to best use AI to create trustworthy sales forecasts.
To take sales analytics to the next level and drive higher adoption, the Sales Analytics team knew that it had to move its data from Tableau Server to Tableau Cloud. One benefit of getting all its dashboards migrated to Tableau Cloud is that it would enable the team to use AI-driven solutions like Tableau Pulse, which leverages generative AI and LLMs built on Salesforce’s Einstein Trust Layer.
How Tableau Helps
Powerful what-if scenario planning for increased forecast accuracy
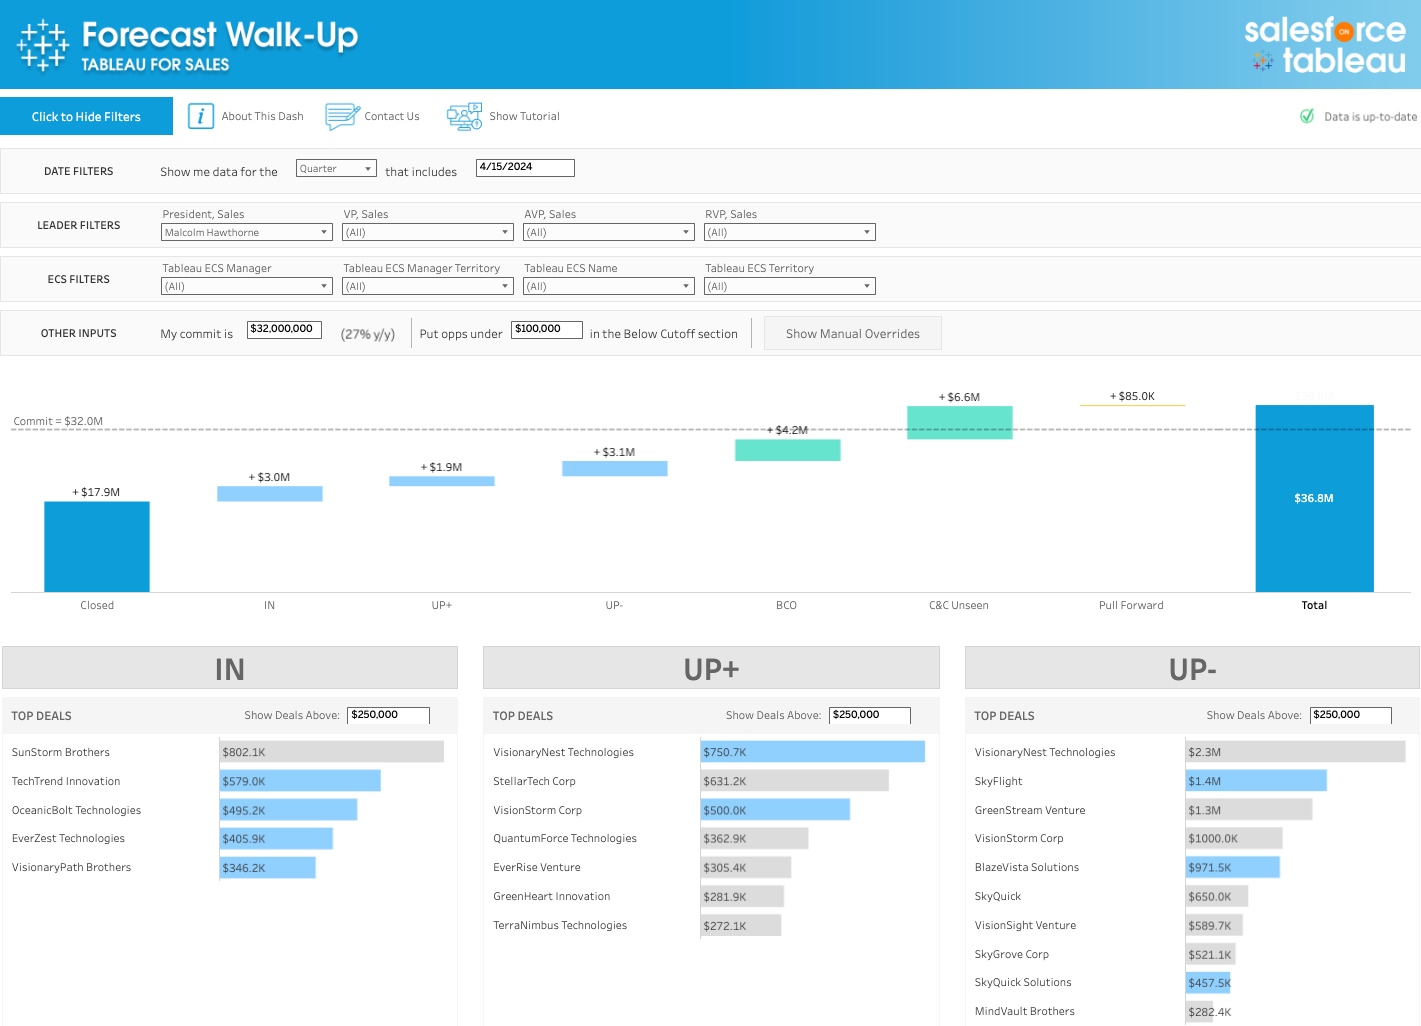
When asked about dashboards they would value the most, the global Salesforce sales team made it clear that they wanted easy access to world-class sales forecasting for their accounts. In response, Tableau analysts and data engineers came together with the Salesforce sales strategy team to create a new suite of tools, including the Forecast Walkup Dashboard. This interactive Tableau visualization allows account executives (AEs) and Sales leadership to generate, validate, and adjust forecasts on the fly with run sophisticated what-if sales scenarios. Armed with these insights, sales leaders can move faster and with greater confidence.
Traditional sales analytics often don’t go much beyond a record of how many calls each AE made and how many deals they’ve closed. Tableau transforms this model by giving sales reps the ability to visually understand the state of the business, get actionable customer insights in context, and securely connect data from anywhere to drive better collaboration across revenue-generating teams. Beyond forecasting, the team has developed tools and dashboards that align with the customer journey – creating new pipeline, cleaning the pipeline, progressing the pipeline, and closing business – as well as contract renewals.
Tableau Pulse works as a major enabler here, helping Sales teams stay focused and proactive by delivering real-time, AI-powered notifications about key pipeline metrics. It provides personalized, contextual insights—such as changes in deal velocity, quota attainment, or account activity—directly in tools like Slack. Pulse augments Salesforce and Tableau environments with timely nudges and data-driven alerts that help drive action faster.
Lead updates every 30 minutes
Another popular dashboard developed by the data engineering team is called “Who’s Hot?” and brings together all sales leads coming into the organization – from webinars, trials, events, and other sources. It also updates them every 30 minutes so sales reps can see in near-real time how these leads are engaging with Tableau, how often, and from which accounts. This information guides AEs in who is best to contact, which accounts to prioritize, and which content would be most valuable depending where the account is on their sales journey.
Tableau Pulse metrics also can be set up to answer questions sales leaders commonly ask – about key metrics like ACV (annual contract value), revenue and conversion, and the most popular products – in just minutes. These insights drive better decision making about sales strategy in far less time.
Forecast Walkup has been so successful that it’s now used not just on the Tableau side, but among Salesforce sales as well. Senior executives bought into it, and they’re driving adoption across the whole organization.
Tableau Next will speed more predictable revenue growth
Today, Tableau is implementing its Tableau Next, the world’s first agentic analytics platform, as an analytical engine within Salesforce Agentforce, the world’s first digital labor platform. Tableau Next, built on Data Cloud and integrated with Agentforce, answers natural language queries, delivers consistent definitions across metrics and data, and lets users directly take action on insights via Slack or Salesforce Flows advanced workflows. This integration will deliver even more personalized, contextual, and actionable insights to every AE and sales leader so they can act faster on every opportunity.
One of the most powerful features of Tableau Next is its conversational analytics capability. Using only natural-language questions, AEs – or anyone looking at sales data – can query relevant data sources, generate one-click visualizations, and dig deeper with follow-up questions. Thanks to AI-driven insights embedded in the sales workflow, sales teams can spend more time selling to customers based on a deeper understanding of their business, and less time building a sales strategy from scratch.
I’m really excited about how we’re adapting agents using Tableau Next and where we’re going to put those use cases on top of some of the dashboards we already use.
The Tableau Difference
Using Tableau to modernize data insights is yielding benefits across all of Salesforce, making sales analytics a faster, more effective part of each user’s everyday workflow. Tableau also enables intuitive scorecards that reveal whether AEs are creating the right number of meetings and other activities.
Forecast Walkup and other new sales analytics tools are being enthusiastically adopted across Salesforce’s sales teams. Users appreciate the ability to go beyond mere visual displays of sales data to ask questions about it and address business opportunities and problems based on a deeper understanding of the data. Salesforce executives from regional VPs to global C-Suite have bought into the project and are helping to drive further adoption.
Leveraging Tableau Next’s conversational analytics capabilities will allow users to turn to it whenever they need fast and valuable analytics insights and gives sales leaders new insight into how well their teams are performing without having to jump from one browser or application to another.
The ultimate success metric of these new sales analytics tools is productivity – of AEs and leaders, but also of the analysts who will be spending fewer hours building sales dashboards and more time helping to generate valuable sales insights that close pipeline business. Sales reps from across Salesforce anticipate great things, and as a bonus will have a set of world-class analytics tools to measure their progress.
Many of the dashboards discussed above are available to any Tableau user on the Tableau for Sales Analytics page.