Would You Like A Chart With That? Incorporating Visualizations into Conversational Interfaces
IEEE VIS - Oct 20-25, 2019 (to appear)
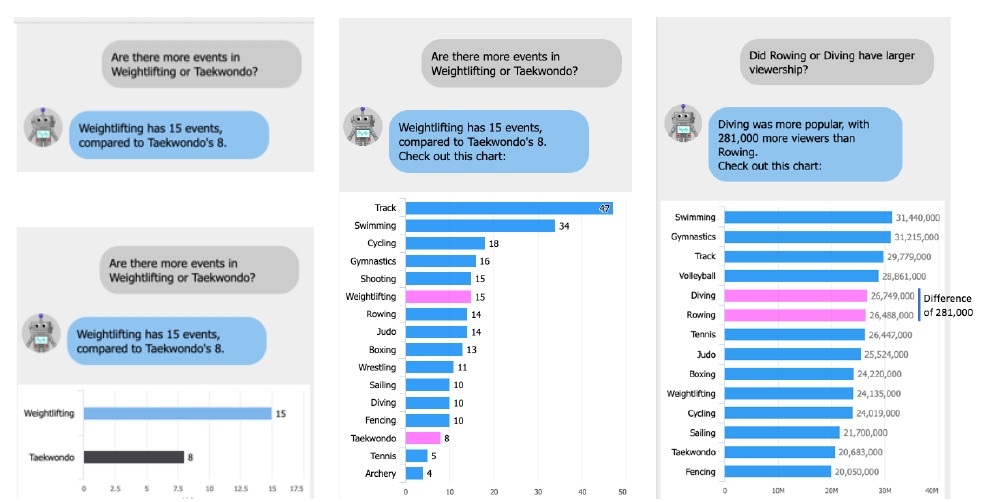
Conversational interfaces, such as chatbots, are increasing in prevalence, and have been shown to be preferred by and help users to complete tasks more efficiently than standard web interfaces in some cases. However, little is understood about if and how information should be visualized during the course of an interactive conversation. This paper describes studies in which participants report their preferences for viewing visualizations in chat-style interfaces when answering questions about comparisons and trends. We find a significant split in preferences among participants; approximately 40% prefer not to see charts and graphs in the context of a conversational interface. For those who do prefer to see charts, most preferred to see additional supporting context beyond the direct answer to the question. These results have important ramifications for the design of conversational interfaces to data.
Créateur(s) Tableau
Auteur(s)
Marti Hearst