Want to go beyond training videos? Try extension activities


As many of you know, we offer tons of free training videos to help you see and understand your data with Tableau. But these videos are just the starting point for learning a new skill. True mastery of a topic usually involves some sort of hands-on practice beyond replicating an example.
That’s where scaffolding comes in. Scaffolding is an educational theory that help students master a new concept, and it often includes modeling and worked examples. Modeling involves demonstrating the new material to students (like we do in the free training videos). Worked examples provide step-by-step explanations of the task related to the material. The end goal is for students to become self-sufficient and able to apply the concepts they’ve learned to novel situations.
Extension activities are a new resource for the free training videos that provide that next step in scaffolding. Each extension activity consists of two workbooks. One lays out the task and any necessary background information, and the matching solution workbook provides detailed step-by-step directions for solving the task. Extension activities build off concepts addressed in the videos and are listed under one or more relevant videos.
Example: Extension activity on formatting tooltips
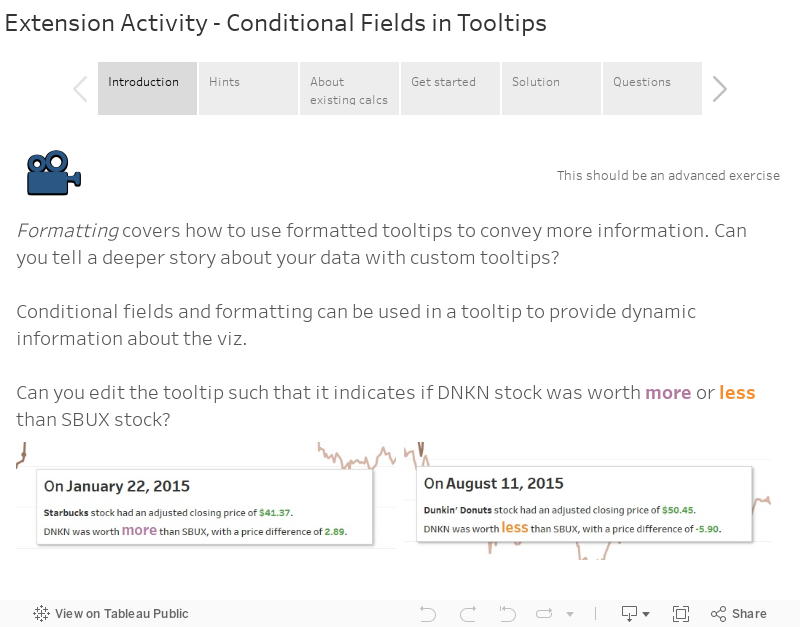
Here’s an example of an extension activity that accompanies our training videos. The formatting video covers how to convey more information by formatting tooltips. There is an extension activity for the formatting video on using conditional fields in tooltips. Download the workbook below to follow along.
Steps
Data set
Stock prices for Starbucks and Dunkin Donuts (2014-2016)
Task
Conditional fields and formatting can be used in a tooltip to provide dynamic information about the viz. Can you edit the tooltip such that it indicates if DNKN stock was worth more or less than SBUX stock?


Hints
You'll need to make a calculated field for each condition you want to format.
- Create a calculated field that indicates when DNKN stock is worth more than SBUX
- Create a calculated field that indicates when DNKN stock is worth less than SBUX
- Add both fields to the tooltip and format them independently
For more information on formatting tooltips, refer to this Knowledge Base article.
About existing calculations
Here’s an explanation of the existing calculations in this workbook:
The data set contains columns for Symbol and Adj Close. To keep this activity focused on the tooltip’s conditional fields, several necessary calculations have already been created.
- First, we needed to break out the adjusted closing price for each symbol. (DNKN Adj Close and SBUX Adj Close). That allows us to compare them with the calculated field Price Difference.
- The Price Difference field can then be used as the basis for the conditional calculations needed for the tooltip.
- To see how each calculation is built, right-click on the field in the data pane and select "edit." This will bring up the calculation editor. Comments have been added using the "//” notation. (Any line that starts with a “//” becomes a comment line shown in green and is ignored by Tableau.)
To start from the raw data alone and create all the calculations yourself, simply delete the three calculated fields mentioned above (or ignore them and make your own—just use different names.)
Ready to dive in? Download the extension activity workbook, go to the tab titled Conditional Format, and try building the calculations and tooltip for yourself. If you get stuck, or if you want to check your work, you can download and view the solution workbook or read on.
Create the calculated fields
One will indicate if DNKN stock is worth less than SBUX, the other if it is worth more.
1. Right-click in white space in the data pane and select "create calculated field." Name it “negative price difference.”
2. Enter the formula: IF [Price difference] = 0 THEN "less" ELSE "" END
You can drag out the field Price difference rather than type it, if desired.
The output for the ELSE option is just two double quotes with nothing inside. That means nothing will show if the condition isn't true.
3. Create another calculation the same way, but name it Positive Price difference and enter the formula:
IF [Price difference] > 0 THEN "more" ELSE "" END
(Refer to this Knowledge Base article for more information.)
Build the tooltip
4. Drag all relevant fields not already in the view to the tooltip shelf (Company, Positive Price difference, Negative Price difference, Price difference).
5. Click on the tooltip shelf to bring up the editor. Clear the default text.
6. Using the insert button in the upper-right corner, insert the relevant fields. The key step here is to insert both “Positive Price Difference” and “Negative Price Difference” right next to each other. Only one can be true at a time; the calculation that is not true will display nothing (because of the empty double quotes "").
7. Type the surrounding text and format as desired. (Refer to this Knowledge Base article for more information.)
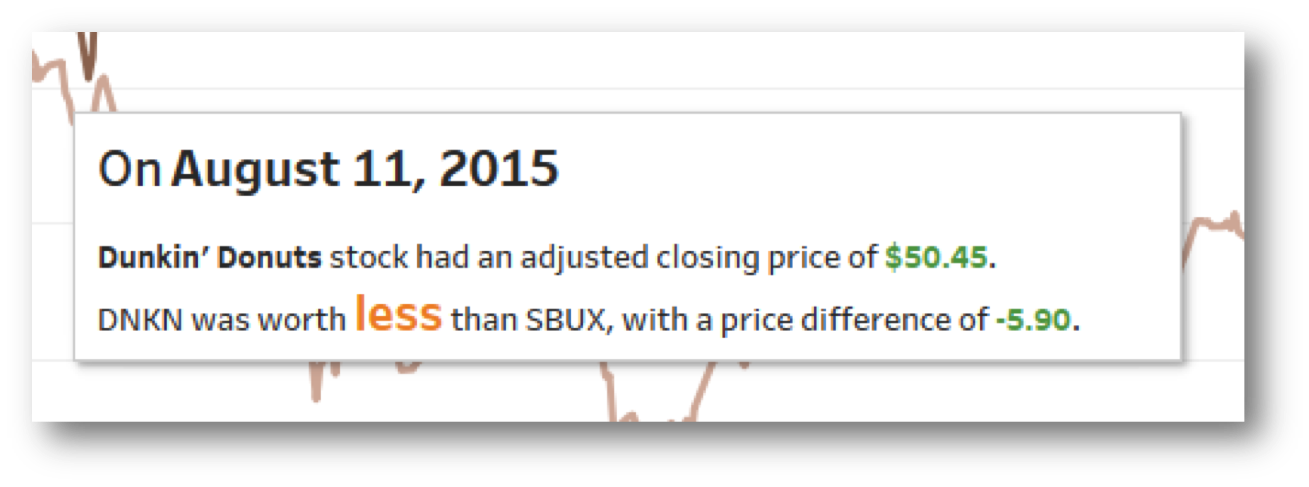
The tooltip could look like this:

Depending on the value of the Mark, only one option will show:

Notes
Command buttons
You can turn off the command buttons in the tooltip if desired.
Using Adj Close Price
In the tooltip, the first line is simply
Price difference is direction-specific
In this activity, the calculations are from the perspective of DNKN (that is, "more" means DNKN stock is worth more than SBUX). If you care more about if SBUX, you can reverse the Price Difference calculation and the conditional calculations.
As you can see, the solutions are detailed—and you might not need that much explanation. That’s fine! The goal of the two-workbook structure is to enable those who are comfortable with a topic to jump right in and try to solve it on their own, but without leaving behind those who need more than the one-way learning of a video. You can ignore the solution workbooks all together, skip over the detail you don’t need, or read through each explanation, all at your own pace.
Hungry for more? The following videos have extension activities, and we’re actively creating more.
Autres sujets pertinents

5 Ways to Use Tableau Public to Achieve Your Goals
 11 janvier, 2025

World Mental Health Day: Elevating Awareness Through Data Visualization
 10 octobre, 2024

From TV Screens to Tableau: Visualize Your Favorite Shows with IMDb
 31 août, 2024