DataFam Roundup: April 24-28, 2023


Welcome! Dig into this week's DataFam Roundup—a weekly blog that brings together community content all in one post. As always, we invite you to send us your content—and the DataFam content from your peers that have inspired you! Find the content submission form here.
Community Highlight
To recognize new and consistent Tableau contributors—we’re excited to have a section within the weekly DataFam Roundup called the Tableau Community Highlight. Find out how to get involved.

Konstantin Weis, Senior Data Technology Consultant at Keyrus
New York, USA
Konstantin Weis is a Senior Data Technology Consultant at Keyrus. Konstantin began using Tableau through his graduate studies at Fordham University and continued to sharpen his skills through YouTube tutorials and blogs. Later, he continued learning Tableau at an internship and through the Tableau Forums, which is now one of the ways that he stays most active in the Tableau Community.
Konstantin loves that the Tableau Forums help sharpen his Tableau skills and solve complex problems. The Forums are also a way for Konstantin to give back to those just beginning their Tableau journey. His formula for answering questions includes outlining his steps and also including additional information—rather than just a quick solution, people can gain context to help them apply the tips in the future.
Another way Konstantin stays connected is through the New York City Tableau User Group. After attending various User Group meetings as a listener, he got involved and now helps organize meetings and speaks at events.
Connect with Konstantin on Linkedin, Tableau Public, the Tableau Forums, and through the New York City Tableau User Group.
DataFam content
Dive into content created by the Tableau Community:
- Mark Bradbourne, Sons of Hierarchies: Tableau’s REGEX and ChatGPT
- CJ Mayes: Expanding your toolkit with Will Sutton
- Data Super Star Gallery
- Brandi Beals: Pro tips to make the most of virtual Tableau Conference
- Sarah Bartlett: Tableau Conference Guide 2023 #data23
Team Tableau
-
Closing the (ideas) loop: Update re. Tableau product ideas, features & releases
-
Exploring Sankey and Radial Charts with the New Chart Types Pilot on Tableau Public
Upcoming events and community participation
-
Iron Viz '23 Quest Trailmix: Iron Viz is the world's largest data visualization competition. Quest on and become a fan!
-
Data Book Club: This spring we'll be reading Avoiding Data Pitfalls: How to Steer Clear of Common Blunders When Working with Data and Presenting Analysis and Visualizations by Ben Jones.
-
TrailblazerDX ’23 Tableau Quest: Leverage the power of data with the world’s leading analytics platform to drive better business decisions.
-
Community Calendar and Upcoming Events: stay up-to-date on the latest Women in Dataviz events and other data visualization-related events. If you'd like to submit an event to the calendar, please fill out this form.
Vizzes
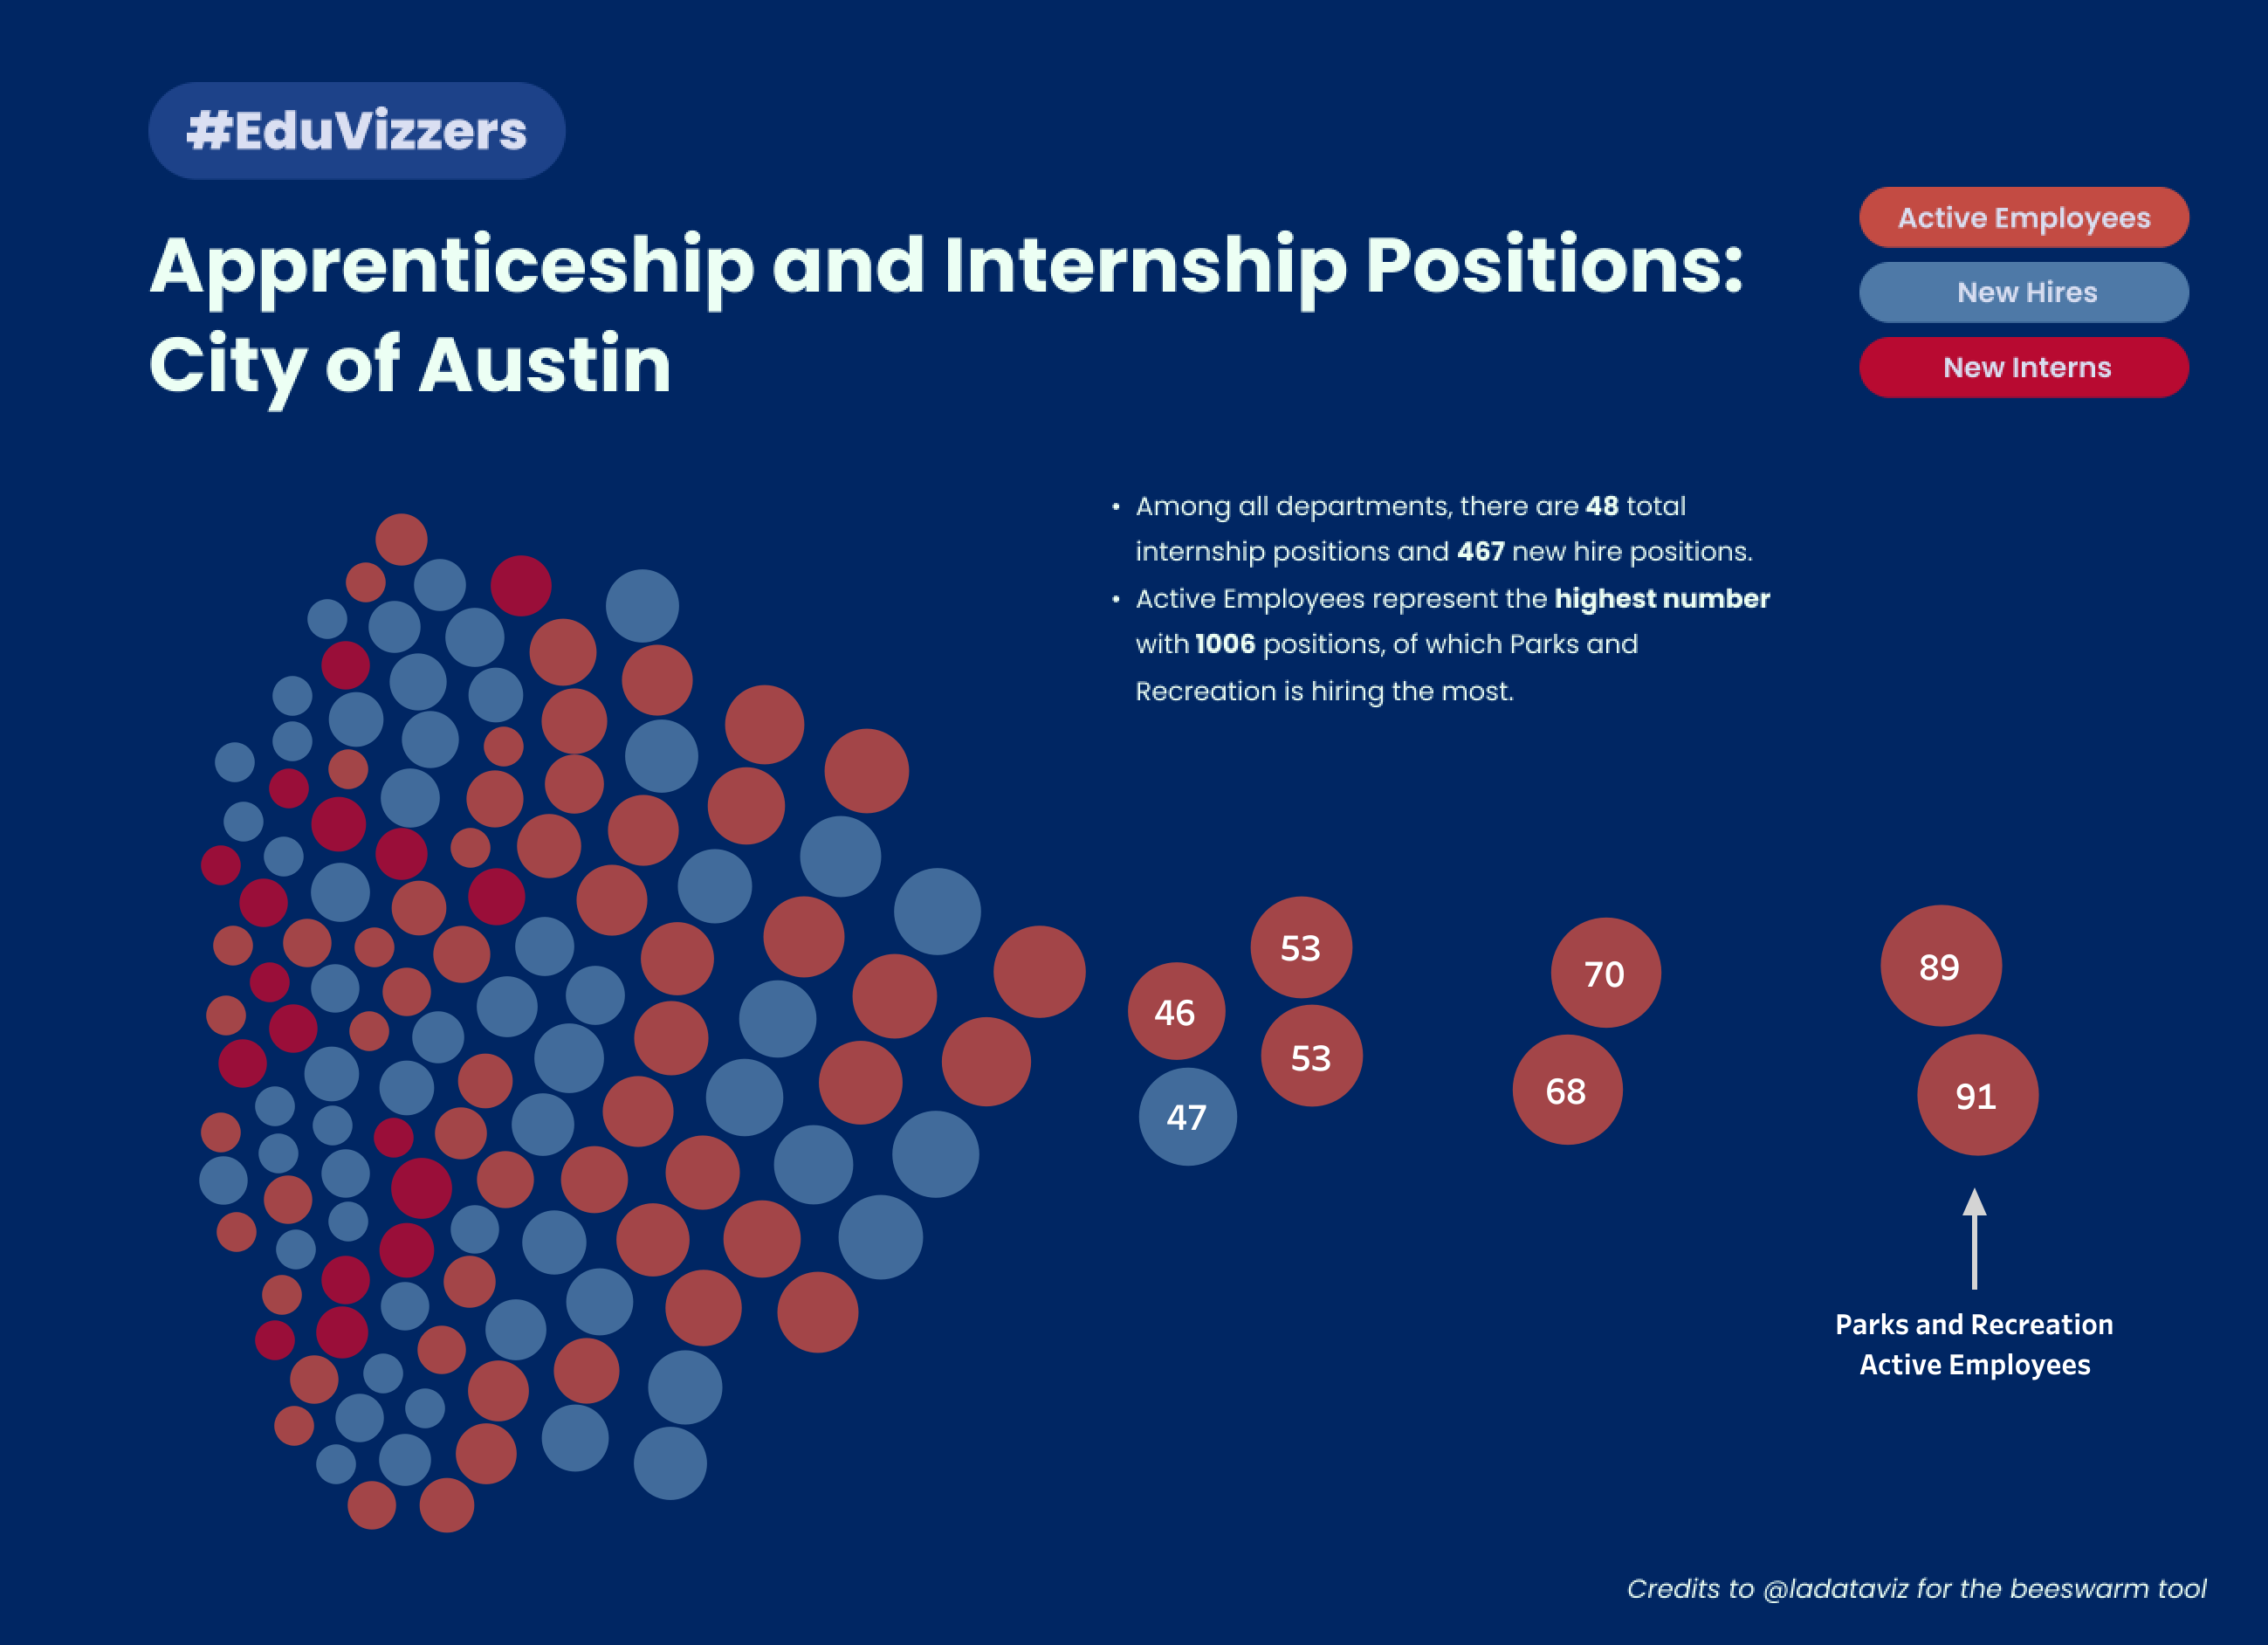
Ian Cedric Io: #EduVizzers Apprenticeship and Internship Positions: City of Austin
See the latest Viz of the Day, trending vizzes, featured authors, and more on Tableau Public.
Check out some inspirational vizzes created by the community:
-
Nik Eveleigh: #WOW2023 W17 - Custom Map Analysis
-
Rosario Gauna: Custom Map Analysis
-
Sam Epley: NBA Season Record History
-
Kashish Rastogi: Comparing UK and USA Inflation Rate
-
Yamil Medina: #MakeoverMonday 2023 Week 17 - Biggest Tomato & Potato Production
- Ian Cedric Io: #EduVizzers Apprenticeship and Internship Positions: City of Austin
-
Khalid Amribet: World's Most Valuable Startups
Community Projects
Back 2 Viz Basics
A bi-weekly project helping those who are newer in the community and just starting out with Tableau. Not limited just to newbies!
Web: Back 2 Viz Basics
Twitter: #B2VB
Week 8: Use Show/Hide
Workout Wednesday
Build your skills with a weekly challenge to re-create an interactive data visualization.
Web: Workout Wednesday
Twitter: #WOW2022
Week 17: Custom Map Analysis
Makeover Monday
A weekly social data project.
Web: Makeover Monday
Twitter: #MakeoverMonday
Week 17: Which country produces the most tomatoes?
Preppin' Data
A weekly challenge to help you learn to prepare data and use Tableau Prep.
Web: Preppin’ Data
Twitter: #PreppinData
Week 17: Population Growth vs Country Size
DataFam Con
A monthly challenge covering pop culture and fandoms.
Web: DataFam Con
Twitter: #DataFamCon
April 2023: Kids Month!
EduVizzers
A monthly project connecting real education data with real people.
Web: Eduvizzers
April 2023: Open Database of Educational Facilities in Canada (ODEF)
Games Night Viz
A monthly project focusing on using data from your favorite games.
Web: Games Nights Viz
Twitter: #GamesNightViz
Level 6: The Final Boss
Iron Quest
Practice data sourcing, preparation, and visualization skills in a themed monthly challenge.
Web: Iron Quest
Twitter: #IronQuest
Storytelling with Data
Practice data visualization and storytelling skills by participating in monthly challenges and exercises.
Web: Storytelling with Data
Twitter: #SWDChallenge
April 2023: design in light and dark
Project Health Viz
Uncover new stories by visualizing healthcare data sets provided each month.
Web: Project Health Viz
Twitter: #ProjectHealthViz
April 2023: The Lown Institute Hospital Index on Equity
Diversity in Data
An initiative centered around diversity, equity & awareness by visualizing provided datasets each month.
Web: Diversity in Data
Twitter: #DiversityinData
April 2023: Arab American Heritage Month & Language
Sports Viz Sunday
Create and share data visualizations using rich, sports-themed data sets in a monthly challenge.
Web: Sports Viz Sunday
Twitter: #SportsVizSunday
January 2023: Is it a Sport or a Game?
Viz for Social Good
Volunteer to design data visualizations that help nonprofits harness the power of data for social change.
Web: Viz for Social Good
Twitter: #VizforSocialGood
Apr 18 - May 23, 2023: World Health Organization (WHO)
Real World Fake Data
Create business dashboards using provided data sets for various industries and departments.
Web: Real World Fake Data
Twitter: #RWFD
Session 5: Diversity Score Card
Data Plus Music
A monthly project visualizing the data behind the music we love!
Web: Data Plus Music
Twitter: #DataPlusMusic
Autres sujets pertinents

DataFam Roundup June 2026

DataFam Roundup May 2026

Iron Viz 2026: Read Between the Data
 28 Mai, 2026