5 reasons GlobalCollect deliver amazing analytics to over 500 customers


You may not have heard of GlobalCollect but you probably have used their services. They control web-based payments for many major services across the world. If you’ve ever bought something online it’s likely you’ve used GlobalCollect.
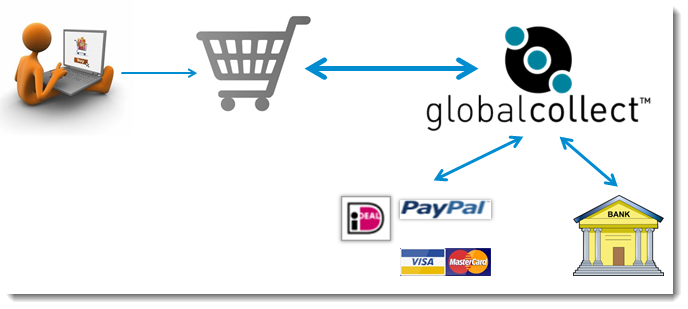
They help clients see how payments are being conducted and improve efficiency as a result, for example by setting the appropriate default currencies for each territory. You might think the default currency would be obvious, but data visualisation has helped clients see unexpected patterns.
Their clients have access to multiple dashboards. Each needs to be updated, maintained and secured. What are the reasons they've succeeded? And what can you learn from them?
1. Follow data visualisation best practice
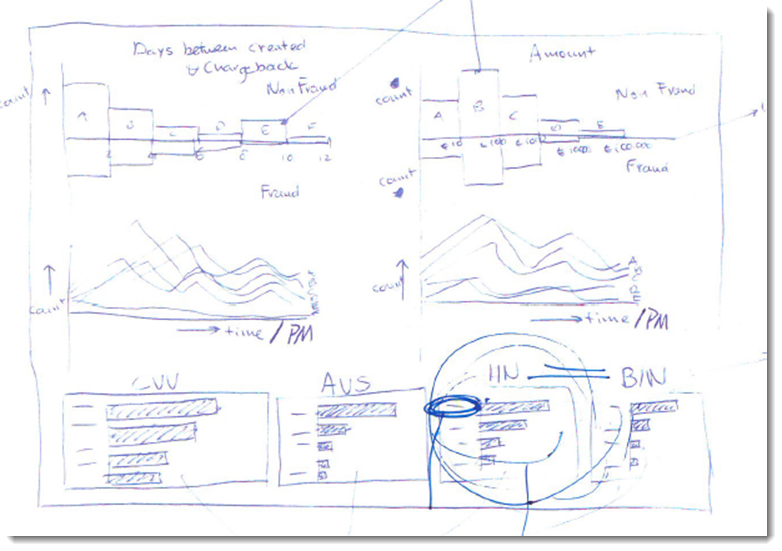
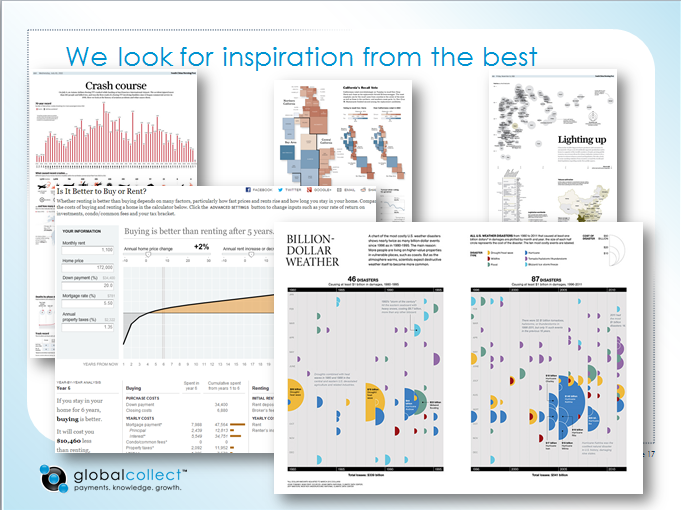
One of the first things they did, before their pilot even started, was to look at lots of the available literature (eg Stephen Few). They went to leading data journalism websites (eg The New York Times). They discussed their ideas with industry thought-leaders. Out of those projects came dashboard sketches that were used for the first prototypes. Thinking ahead like this saves time later on.
2. Know the business questions that needed to be answered
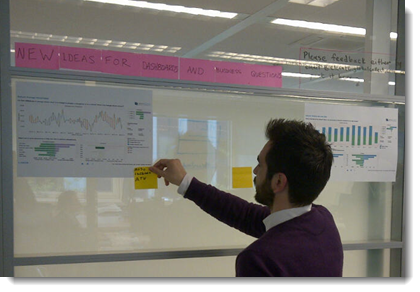
They consulted with their clients to find out what questions they had answered. Many business intelligence projects fail because developers dive into something without a clear definition of the problem to be solved. With applications that allow rapid changes and multiple iterations, the end user is brought along and engaged in the whole process.
3. Measure the effectiveness of dashboards
Sometimes it’s hard to let go of something you’ve created. GlobalCollect measure the usage of each dashboard and discovered that some were not being used. Despite the time and effort spent developing them, they recognized that these should be removed. This helped de-clutter their workspaces and to focus resources on better used dashboards.
4. Maintenance needs resources
Controlling the design, connections and availability of so many dashboards for so many clients is complex and time consuming. There need to be enough people on hand to manage this work.
5. Continuous improvement
A typical old-fashioned business intelligence project would gather requirements up front and then the developers would disappear for a few months. They’d reappear and deliver "The Dashboard". And that would be it. If it needed changing, that was another project and another few months.
GlobalCollect realized this is not the way to run a business intelligence project. A dashboard should never be seen as a finished product. A good dashboard generates more questions, requiring new dashboards. And once a good dashboard has delivered benefit and change in the business, it needs to evolve at the same pace as business needs. This is built in to their approach – to continually measure usage, seek feedback and improve the dashboards in order to provide the best service.
With those six steps, GlobalCollect have delivered a successful engagement suite of analytical dashboards which are a large success in their organisation.
Autres sujets pertinents
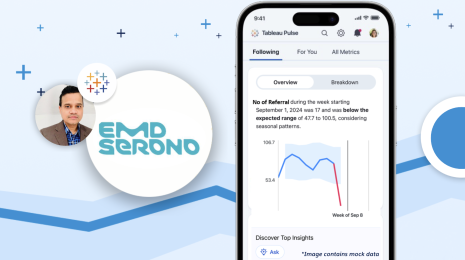
How EMD Serono is improving patient care with personalized, AI-powered insights from Tableau
 30 septembre, 2024

Embedded Analytics: Should you build or buy?
 7 juin, 2022

Data fabric’s value to the enterprise
 11 Mai, 2022