TC recap, network chart among best of the Tableau web


If you see a sad faced man in an “I break @Tableau” tee in the Austin airport, it’s me. So long, #data16
— Jonathan Drummey (@jonathandrummey) November 11, 2016
Starting a #data16 withdrawal support group.
— Matt Francis (@Matt_Francis) November 12, 2016
But fear not! We've got a list of recap posts below to help you relive the magic. You can also catch our recorded sessions online. And find yourself and your friends using this network chart by Keith Helfrich and Chris DeMartini, and pick up the #data16 conversation where you left off.

And without further ado, here's the rest of the best of the Tableau web.
Tips & tricks
The Data School How to make: Simple control chart
VizWiz How to swap metrics in a single table and conditionally format the values
InterWorks Tableau deep dive: Sets - calculated fields
3danim8 How I use #Tableau LODs to process asynchronous time-series data
Data + Tableau + Me Feedback, math, and the power of Tableau
Data Revelations Getting survey data 'just so' using Tableau
DataRemixed How to use Tableau and Plotly together
Beyond the basics
The Information Lab Tableau’s Document API & Python: Part l
Data + Brit Using Python for sentiment analysis in Tableau
Scaling with Tableau
Tableau Fit How the EXCEL do I implement Tableau? The Cliff’s Notes version to Tableau Drive
Tableau Junkie Windows batch file for Tableau Server silent install
Dashboard design
Datasaurus Rex What makes a good data visualization?
Vizible Difference Going from flat to float
TC Roundup
InterWorks Highlights from the Tableau Conference 2016 keynote
Tableau Wannabe Podcast #Data16 series
Tri My Data #Data16: What a week it has been!
Chad Skelton TC16: My favourite Tableau Conference 2016 sessions
Datasaurus-Rex Tableau Conference 2016 roundup
Wannabe Awesome Me Get along little #data16 doggy
Have a blog post to add to this list? Share it with us in the comments below. And if you blog about Tableau, tweet us @Tableau and let us know.
Historias relacionadas

Product Innovations at Tableau Conference 2024
 30 Abril, 2024
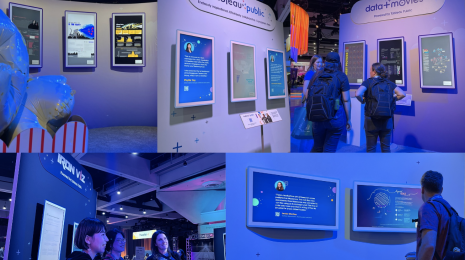
The Tableau Public Viz Gallery at Tableau Conference 2024
 29 Abril, 2024
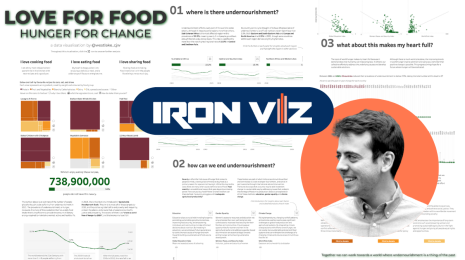
Meet Iron Viz 2024 Finalist Chris Westlake
 22 Abril, 2024
Suscribirse a nuestro blog
Obtén las últimas actualizaciones de Tableau en tu bandeja de entrada.