Featured Authors: Black History Month Edition 2024


Recognized every February in the US and Canada, Black History Month is dedicated to honoring the history, culture, and accomplishments of African Americans. It's an opportunity to celebrate the richness of Black communities and their significant contributions.
Throughout February, we're celebrating the profound impact of African American voices in the Tableau Community. Get ready to meet our new cohort of Featured Authors, and prepare to be inspired by the remarkable work these data rock stars have created over the past months or even years.

Aliaa, a student at George Mason University, is on track to graduate with a Master's in Business Analytics. Her visualization journey began in 2023 during a data bootcamp, where she discovered Tableau's ease of use and storytelling capabilities. Aliaa's passion lies in visualizing topics related to music and empowerment. Inspired by the power of data storytelling, she has embraced Tableau as a tool to bring her narratives to life. Connect with Aliaa on Tableau Public or LinkedIn.

Daniella Egure, a Global Supply Chain Design Analyst at a multinational food company, discovered her passion for data visualization through Tableau Public. Her expertise lies in creating visualizations that enable companies to uncover savings and drive profits, thus fostering growth. Tableau Public allows her to share data insights globally, capitalizing on its accessibility and community support. She particularly values Tableau Public's capacity to enhance author recognition and serve as a powerful resume tool. Daniella's commitment to Tableau led her to become a certified Tableau Desktop specialist, solidifying her dedication to data visualization. Connect with Daniella on Tableau Public or LinkedIn.

Etalia Shakir , a Senior Data Science Analyst at First Citizens Bank, has embraced Tableau's artistic and innovative power for 4 years. She’s been a huge advocate of Tableau since she discovered it during her Master of Mathematics program at the University of Alabama. As a Certified Tableau Data Analyst, she crafts dashboards optimizing conference schedules—such as the AfroTech 2023 Schedule—sales processes and forecasting (2015 Walmart Performance Report), and benchmark analysis worldwide. Tableau is her consistent playground, and she's the go-to person on her team for navigating its powerful platform. She shares her expertise and passion for data visualization and dashboard development on social media through her TikTok channel. Connect with Etialia on Tableau Public.

Fagbamigbe Kehinde, a Business Intelligence engineer at Google, is passionately dedicated to crafting meaningful data visualizations. His Tableau Public journey started in 2019 with #MakeoverMonday, where he found a dynamic community and invaluable space for exploration. Creating proprietary charts for decision-making, Kehinde relies on Tableau for insightful data, frequently immersing himself in Tableau Public to learn insights and techniques from others' visualizations. He recognizes and is thankful to the Flerlage Twins for their inspiration and mentorship throughout his journey. Connect with Kehinde on Tableau Public or LinkedIn.

Frederick Soh, a business intelligence analyst in the healthcare industry, heavily relies on Tableau for daily data analysis and visualization tasks. Its user-friendly interface helps him craft dynamic visuals for client reports and internal dashboards, facilitating informed decision-making. Tableau Public enables him to share creations widely, fostering collaboration within the data community. Over the past three years, he has dedicated himself to mastering Tableau Public, striving for improvement. His passion lies in visualizing business and finance data to improve decision-making processes. Connect with Frederick on Tableau Public, X, or LinkedIn.

Sharon Machiri, a Certified Tableau Developer, embodies excellence and innovation in data visualization. With extensive experience, she excels in crafting interactive reports and dashboards for insightful data analysis. Celebrating Black History Month, Sharon’s journey underscores the significance of diversity and inclusion in technology, showcasing resilience and grace amidst challenges. Through initiatives like "Learning Fridays," she fosters a supportive environment for women in tech to thrive. Active in the Tableau Public community, Sharon engages in projects like Makeover Monday, drawing inspiration from fellow authors. In her current role, she thrives as a Tableau Developer, continuously seeking to enhance her skills in data visualization. Connect with Sharon on Tableau Public or LinkedIn.
Be sure to follow this extraordinary group from around the world who are crushing it. Looking for some extra inspiration? Subscribe to Viz of the Day, search Tableau Public, or visit the homepage to see the latest and greatest. Pro tip: If you sign in you'll see new content curated just for you.
If you don’t have a Tableau Public profile yet, create one for free and start honing your own data visualization portfolio. Learn how to grow and refine your data skills with Tableau Public.
Related Stories
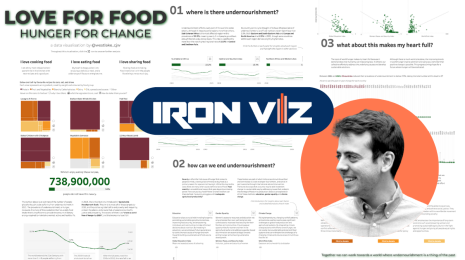
Meet Iron Viz 2024 Finalist Chris Westlake
 April 22, 2024
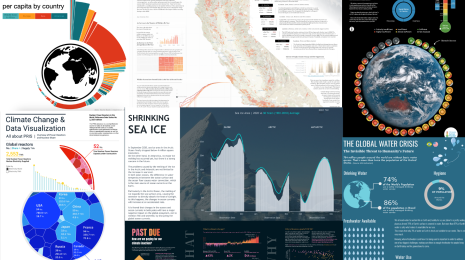
Visualizing Climate Change: Expert Tips from #TheSDGVizProject Leaders
 April 22, 2024

Meet Iron Viz 2024 Finalist Jessica Moon
April 15, 2024
Subscribe to our blog
Get the latest Tableau updates in your inbox.