27 Data Visualizations to Gain Insight into Global Literacy


International Literacy Day was first celebrated in 1967 by UNESCO to remind the public of the importance of literacy as a human right. Literacy can range from being able to read and write your language to being able to see and understand data. Tableau is helping close the data literacy gap by enabling 10 million people by 2027 with free data skills resources and providing free software and training to students and teachers in higher education. To learn more about how Tableau is making a difference, visit our Data Skills 10 Million and Tableau Academic Programs home pages.
Discover how time and location has impacted literacy by clicking through the vizzes below created by the Tableau Community. Every viz is hosted on Tableau Public, Tableau’s free platform used to explore, create, and publicly share data visualizations. No matter where you are in your data viz journey, learn how to get the most out of Tableau Public—from creating a free profile to publishing your own data visualizations with confidence–in our Beginner’s Guide.

World Literacy

State of Literacy in the World 2022

Closing the Youth Literacy Gap | Iron Viz 2022

Literacy

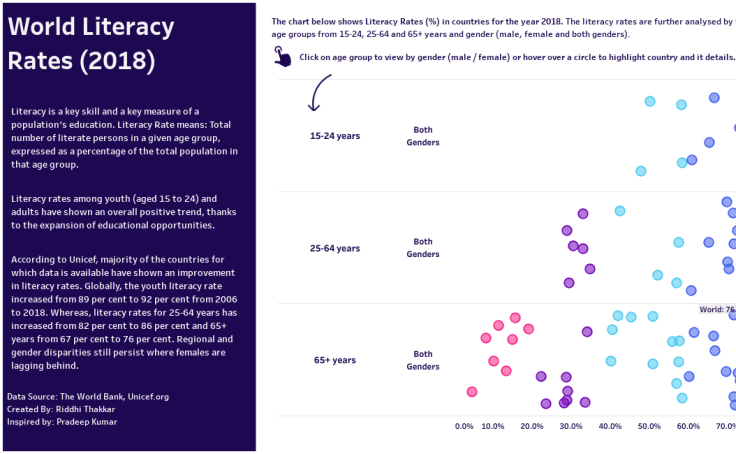
World Literacy Rates

World Literacy Rates

World Literacy
World Literacy Rates


Literacy: Africa Vs the rest of the World

Literacy Rates in the World between 2010 and 2018

Literacy – Deloitte Viz Games 2022 by Deloitte CZ

Literacy Gender Inequalities

The Gender Literacy Gap

Literacy Rate Around the World

Literacy - #IronVizStudentEdition 2022


The Impact of Education | Iron Viz: Student Edition 2022

Literacy Day | Women vs Men

Literacy Rate in India

SDG-4-Quality Education - Global Literacy Rates

Literacy Rate in India

Literacy Rate in Tamil Nadu State

MakeoverMonday Week 46 Literacy Rates

Literacy Rate In India

Literacy Rate in Asia
Related Stories
DataFam Roundup July 7-11, 2025
Tableau New Features Released in 2025 from Community Ideas
 July 1, 2025
