Introducing Logshark: Analyze your Tableau Server log files with Tableau


Have you ever run into issues with Tableau Server? Have you ever had to peruse a lot of Tableau server log files to figure out what may be causing the issue? If so, then you've probably wished for a tool that can help you self-diagnose and visualize these errors more easily.
Wish no further! We've heard your feedback, and we are happy to announce the release of Logshark, an open-source, self-service tool to help you analyze Tableau log files using a product you already love, Tableau!
Logshark is a command-line utility that you can run against Tableau logs to generate a set of workbooks that provide insights into system performance, content usage, and error investigation. You can use Logshark to visualize, investigate, and solve issues with Tableau at your convenience.
Some common use cases for Logshark include:
- Troubleshooting issue(s) that are recorded in the logs
- Analyzing system metrics from log data
- Self-solving problems in Tableau without the fear of exposing sensitive corporate information
- Regularly validating Tableau Server application behavior against historical data when taking a new build or making a system change
How Logshark works
Logshark parses a Tableau log archive into a format that can be queried and stored in MongoDB, at which point a set of analysis plugins run that extract and transform specific data out to a Postgres data source. This data source is then used to generate a set of Tableau workbooks that provide visual insights into the logs.
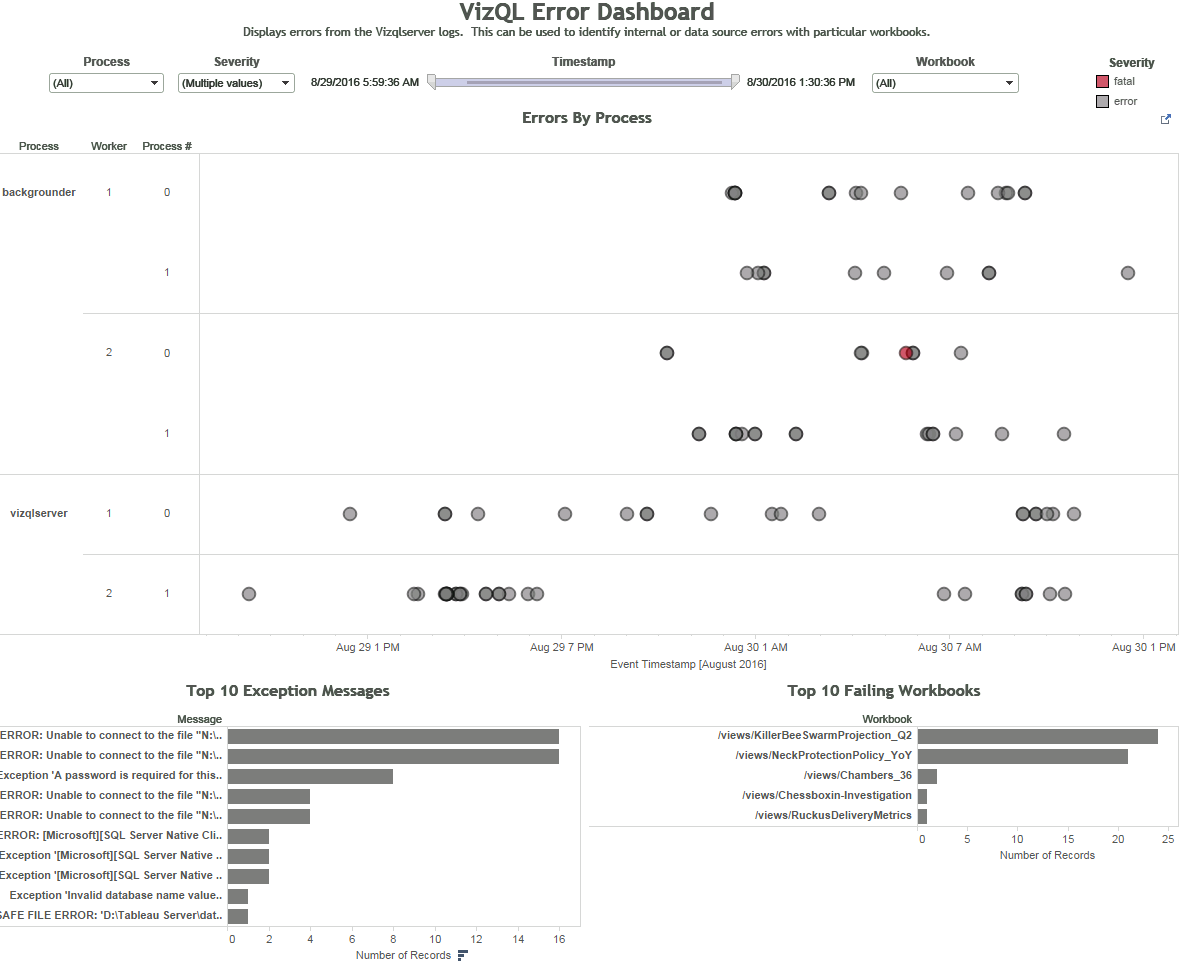
Workbook generated from the VizQL server logs showing errors with particular workbooks.
How we use Logshark
Over the last few months, we have been using Logshark to help resolve customer support cases and debug issues with our internal Tableau Server environments. We also use it to track historical data around internal server configurations and usage.
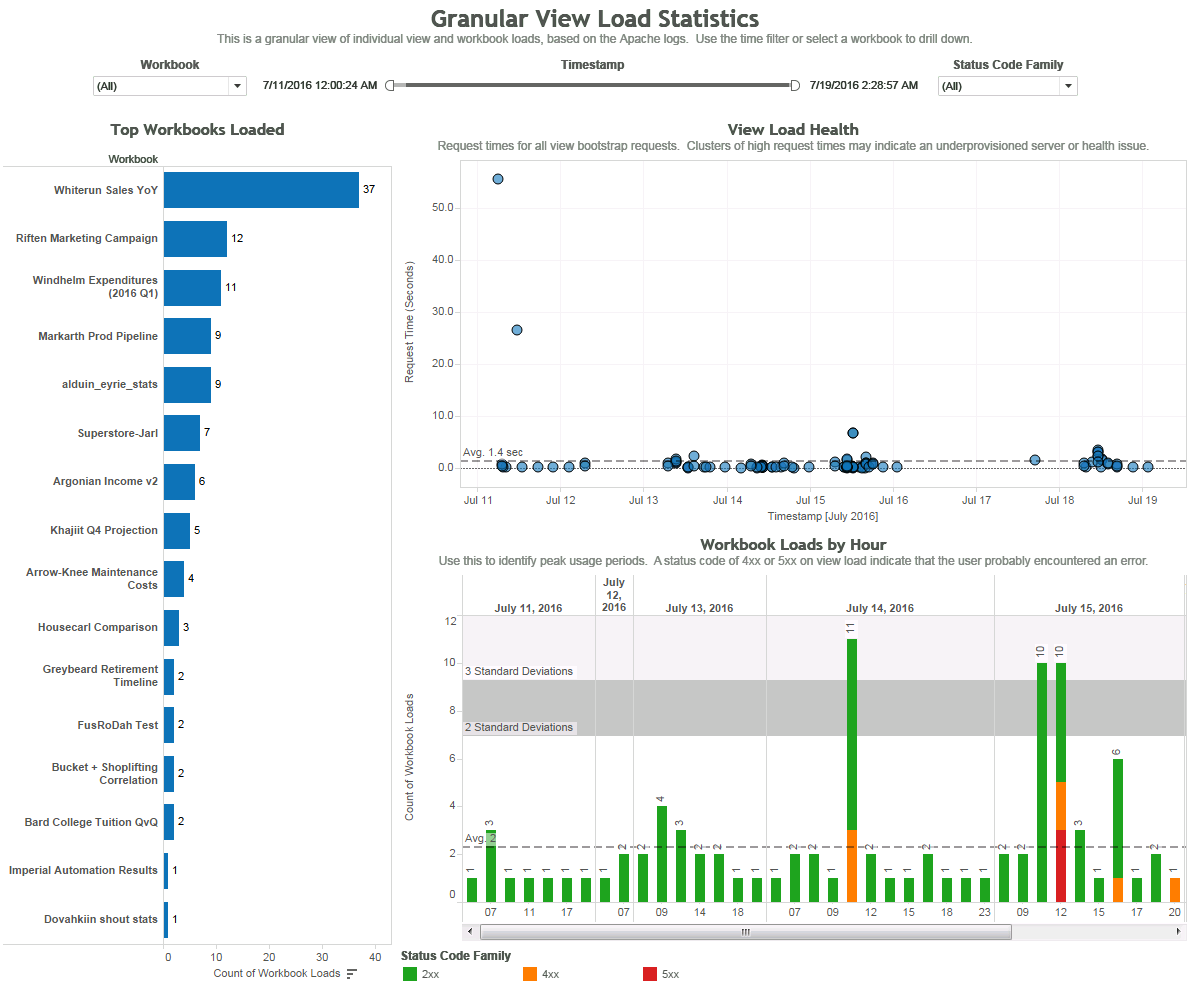
For example, Logshark was instrumental in quickly diagnosing a performance issue on the internal servers by highlighting the set of workbooks that were associated with the slowness.
In another example, we used Logshark as a part of the customer investigation process. With Logshark, we created a custom view comparing performance for a workbook of interest across Tableau 9.1, Tableau 9.3.3, and Tableau 9.3.6. This view very clearly validated that the workbook's performance had actually improved in Tableau 9.3.
Where to get Logshark
Logshark is made available as-is with no support from Tableau's technical support team. Download Logshark, read our installation guide, and if you need any help or would like to share feedback, let us know via the Logshark Git Issue Tracker. You can also download or fork the source on the Logshark GitHub page.
We hope Logshark will come in handy as a self-service tool, and we hope you'll make your own creative contributions back to the community!
Note: If you are upgrading from a previous version of Logshark, the installer will handle most of the upgrade work for you. But during the upgrade, your Logshark.config file will be overwritten. If there are settings from this config you wish to preserve, ensure you create a backup of this file prior to upgrade.
Learn more about Logshark at TC16
Headed to Tableau Conference in Austin? We have two sessions on Logshark that may interest you. If you're new to Logshark, check out our breakout session for a demo and an introduction to one way that Tableau visualizes log data. If you already use Logshark and would like to meet the developers of the tool, join us at our meetup.
Autres sujets pertinents
How EMD Serono is improving patient care with personalized, AI-powered insights from Tableau
 30 septembre, 2024

Embedded Analytics: Should you build or buy?
 7 juin, 2022

Data fabric’s value to the enterprise
 11 Mai, 2022