Toutes les histoires de Social Impact
 Social Impact
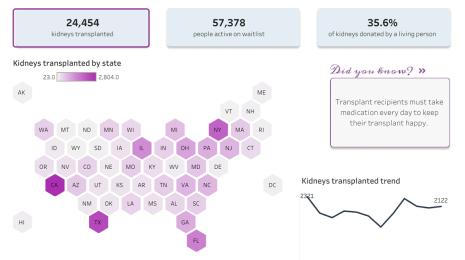
From Kidney Donation to Tableau Dashboard
 25 octobre, 2022
Data is critical to any decision, like a kidney donation. Learn how Tableau dashboards educate the need to donate this important organ.
25 octobre, 2022
Data is critical to any decision, like a kidney donation. Learn how Tableau dashboards educate the need to donate this important organ. Social Impact
Using data to drive conversations about climate change
 28 avril, 2022
Learn how Tableau partners are using data to drive conversations about climate change and create solutions within communities.
28 avril, 2022
Learn how Tableau partners are using data to drive conversations about climate change and create solutions within communities. Social Impact
Leveraging data to improve forestry practices worldwide
The Forest Stewardship Council uses impact data to improve sustainable forest management globally. Social Impact
Tracking gender equality with data: the 2022 SDG Gender Index
 21 mars, 2022
The 2022 Sustainable Development Goals Gender Index from Equal Measures 2030 provides insights on overall progress towards gender equality worldwide.
21 mars, 2022
The 2022 Sustainable Development Goals Gender Index from Equal Measures 2030 provides insights on overall progress towards gender equality worldwide. Social Impact
Visualizing the DC Police budget
 28 janvier, 2022
Democratizing and demystifying the DC Police Budget through a single database that increases accessibility and transparency on how public money is spent on policing, including the funding of police in schools.
28 janvier, 2022
Democratizing and demystifying the DC Police Budget through a single database that increases accessibility and transparency on how public money is spent on policing, including the funding of police in schools.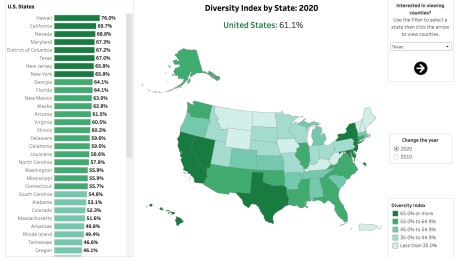 Social Impact
U.S. Census data reveals growing racial and ethnic diversity
 13 janvier, 2022
U.S. Census Bureau 2020 data shows a more multi-racial, diverse America. As depicted in several Tableau dashboards, users can see demographic shifts from 2010 to 2020.
13 janvier, 2022
U.S. Census Bureau 2020 data shows a more multi-racial, diverse America. As depicted in several Tableau dashboards, users can see demographic shifts from 2010 to 2020. Social Impact
Combating racial inequity with data: A progress report and look ahead
17 décembre, 2021
Tableau data advocacy stories and visualizations show how advocates across the U.S. are doing good with data and illuminating areas to deliver equity. Social Impact
Doing Good Data Means Doing No Harm
 13 décembre, 2021
10 recommendations to help data communicators and organizations lead with empathy and do good with data.
13 décembre, 2021
10 recommendations to help data communicators and organizations lead with empathy and do good with data.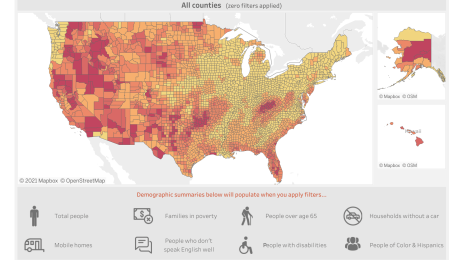 Social Impact
Wildfire risk is an equity issue
9 décembre, 2021
Tableau data visualizations from Headwaters Economics show how vulnerable populations suffer disproportionate exposure to catastrophic loss from wildfire.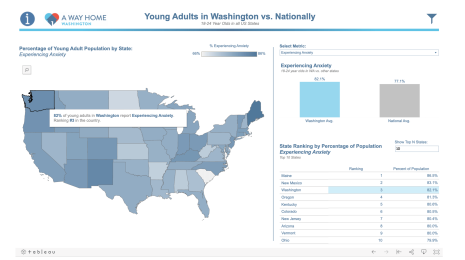 Social Impact
Visualizing COVID-19’s impact on youth homelessness, and using data in support to help end it
 14 novembre, 2021
Learn how a Tableau dashboard is helping counties in Washington state visualize and track progress toward ending youth homelessness.
14 novembre, 2021
Learn how a Tableau dashboard is helping counties in Washington state visualize and track progress toward ending youth homelessness.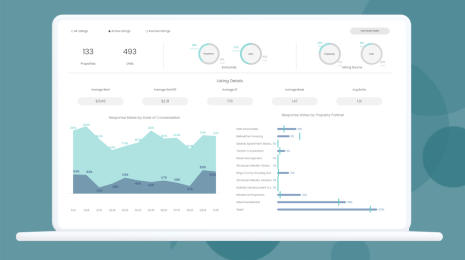 Social Impact
Housing Connector uses data to help families find homes
30 octobre, 2021
Housing Connector is helping unhoused people find stable rental housing using data analysis in Tableau to understand and address challenges faced by applicants.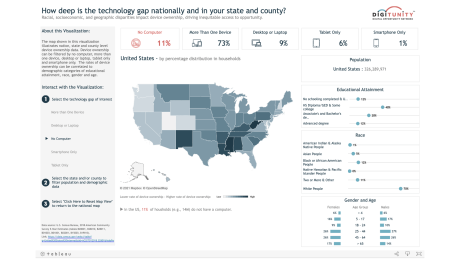 Social Impact
Mapping technology gap data to address and eliminate the digital divide
15 octobre, 2021
Explore how Digitunity’s network of digital inclusion practitioners are visualizing data in Tableau and working to scale digital equity for all.