Visualize your Data
Full-version trial. No credit card required.
Data visualization is the graphical representation of information and data. With visual elements like charts, graphs, and maps, data visualization tools provide an accessible way to see and understand trends, outliers, and patterns in data.
In the world of big data, data visualization tools and technologies are essential to analyze massive amounts of information and make data-driven decisions. Our culture is visual, including everything from art and advertisements to TV and movies, and our eyes are drawn to colors and patterns. Our interaction with data should reflect this reality.
Make your data better
This visualization shows San Francisco Airbnb listing data on a map. Because all of the listings are the same size and color, even with filters, it’s hard to differentiate the value between the listings at a glance.
Take your viz from good to great with just a few tweaks.
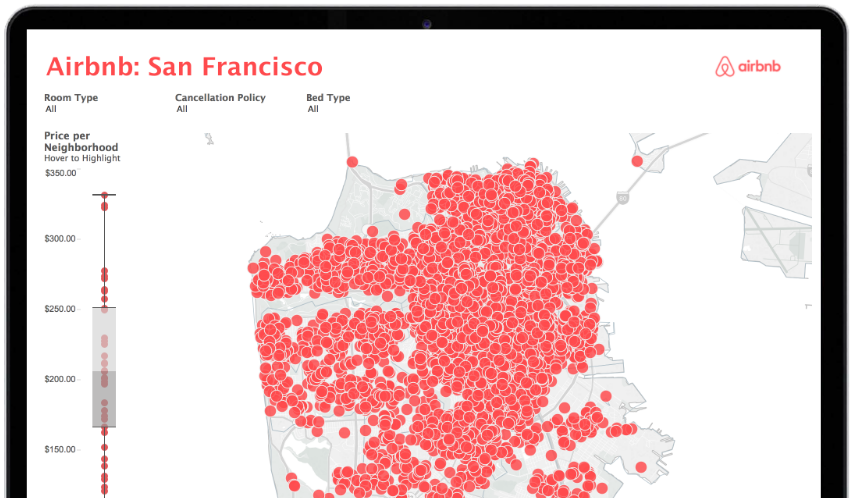
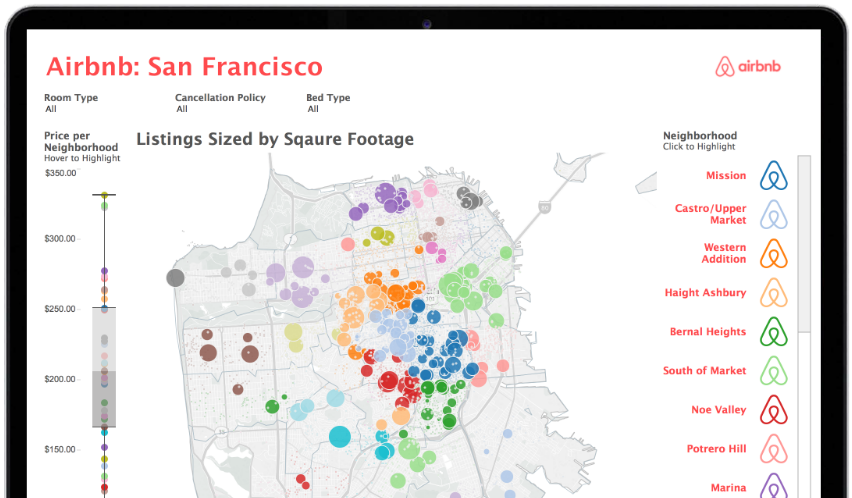
Tableau is one of the best tools out there for creating really powerful and insightful visuals. We’re using it for analytics that require great data visuals to help us tell the stories we’re trying to tell to our executive management team.


Visual Analytics helps Southwest Airlines maintain on-time flights and optimizes fleet performance
Watch nowVisualize your data in Tableau
Broadest, deepest analytics platform
Deploy in the cloud, on-premises, or natively integrate with Salesforce CRM. Connect to all of your data with fully integrated AI/ML capabilities, governance and data management, visual storytelling and collaboration
Intuitive products
We believe data analysis should be about asking questions and not about learning software. With built-in visual best practices, Tableau provides limitless data exploration without interrupting your flow of analysis.
United by data
There is no single way to accelerate your Tableau journey, but all roads lead through the Tableau Community. With more than a million members, here you have the power to connect with like-minded people, learn, grow, and be inspired—wherever you are in the world.
Your partner to build a Data Culture
Customers are scaling Tableau faster and more broadly than ever. As a trusted partner, Tableau helps organizations accelerate innovation, improve operations, and better serve their customers.
Tableau a la confiance de :


