Todas las historias de
 Visualizations
My summer job made me angry, so I looked to the data
The not-so-fun part of working in tourism in the summer: I had to let many customers know their dream trips were already sold out. I had a feeling the time span between the initial inquiry and the desired departure date was getting smaller every day. Naturally, I needed to validate my feelings with hard facts.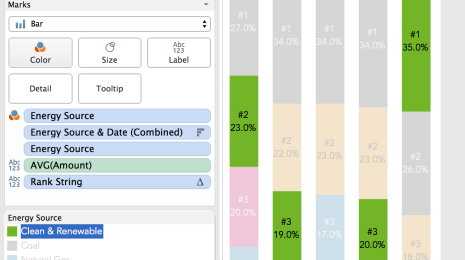 Visualizations
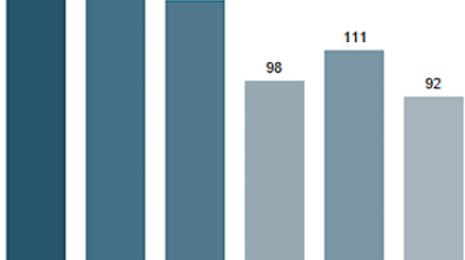
Tableau tip: How to sort stacked bars by multiple dimensions
For Makeover Monday, I wanted to tell the story of how Facebook is making an effort to make clean and renewable power its primary source of energy. I wanted to be able to sort the stacked bars by energy usage percentage by year. Here's how it's done.
 Enterprise
5 consejos para mejorar el rendimiento de su instancia de Tableau Server
Usted ya sabe que Tableau Server es una poderosa plataforma de colaboración. Le permite fácilmente compartir y distribuir libros de trabajo y dashboards creados en Tableau Desktop. Puesto que los miembros de toda la organización dependen de Tableau Server, es fundamental que tenga un buen rendimiento y sea escalable. Si sigue estos cinco consejos, podrá mejorar el rendimiento de su instancia de Tableau Server, simplificar las tareas de administración y asegurarse de que su inversión sea escalable.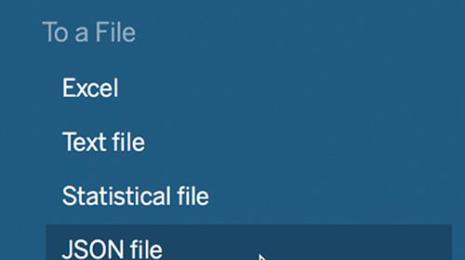 Product
Tableau 10.1 beta is here
 31 Agosto, 2016
Hot on the heels of Tableau 10, we are excited to launch the Tableau 10.1 beta! Tableau 10.1 includes new connectors and improved visual analytics capabilities to help you analyze your data even faster. For the enterprise, we’ve added big extensibility enhancements and more tools for server admins.
31 Agosto, 2016
Hot on the heels of Tableau 10, we are excited to launch the Tableau 10.1 beta! Tableau 10.1 includes new connectors and improved visual analytics capabilities to help you analyze your data even faster. For the enterprise, we’ve added big extensibility enhancements and more tools for server admins.
 Partners
Bringing the power of natural language to Tableau
 30 Agosto, 2016
Our new developer APIs are not quite as obvious as some Tableau 10 features, but they enable some pretty cool product integrations that we think you’ll like! In this post, I’m going to talk about an integration that enables something called natural language generation (NLG) which can extend the impact of your Tableau visualizations.
30 Agosto, 2016
Our new developer APIs are not quite as obvious as some Tableau 10 features, but they enable some pretty cool product integrations that we think you’ll like! In this post, I’m going to talk about an integration that enables something called natural language generation (NLG) which can extend the impact of your Tableau visualizations.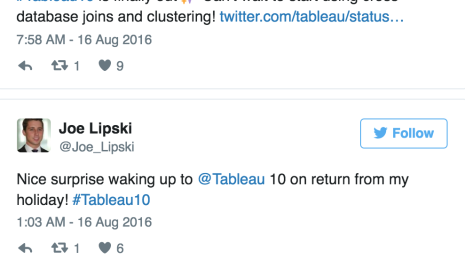 Tableau Community
Roundup: Your Tableau TEN-ured stories and #Tableau10 moments
 29 Agosto, 2016
The release of Tableau 10 was the most community-driven release in Tableau history. From the Tableau 10 Virtual User Group to the Tableau Torch Relay, to Tableau 10 Live, you, our amazing community, have been with us every step of the way. When Tableau 10 launched, we asked you to share the stories of your own Tableau journey. Here are some of your stories and #Tableau10 moments as curated by Tableau Social Media Ambassadors.
29 Agosto, 2016
The release of Tableau 10 was the most community-driven release in Tableau history. From the Tableau 10 Virtual User Group to the Tableau Torch Relay, to Tableau 10 Live, you, our amazing community, have been with us every step of the way. When Tableau 10 launched, we asked you to share the stories of your own Tableau journey. Here are some of your stories and #Tableau10 moments as curated by Tableau Social Media Ambassadors. Tableau Community
And that’s a wrap for the Tableau Torch!
 26 Agosto, 2016
The Tableau Torch Relay has come to a close, and man, what a journey it was! From Seattle to New York and across the Atlantic, the torch made 10 stops in all, and ended its journey with a wrap party in London. And three of the torchbearers were there to celebrate with the London Tableau community.
26 Agosto, 2016
The Tableau Torch Relay has come to a close, and man, what a journey it was! From Seattle to New York and across the Atlantic, the torch made 10 stops in all, and ended its journey with a wrap party in London. And three of the torchbearers were there to celebrate with the London Tableau community.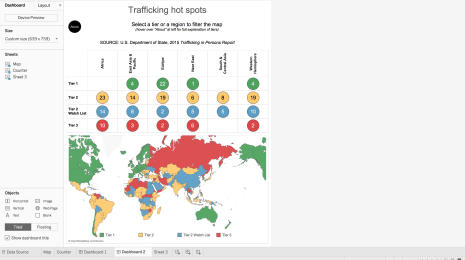
 Visualizations
How to add context to Marimekko charts in Tableau
Throughout this series, we've been exploring admission rates at the University of California in Berkeley. In 1973, the overall graduate-school admission rates for men and women appeared to be biased toward men. But when looked at in more detail, the trend shifted the other direction. In four of the six largest departments, there were proportionately more women admitted than men.


